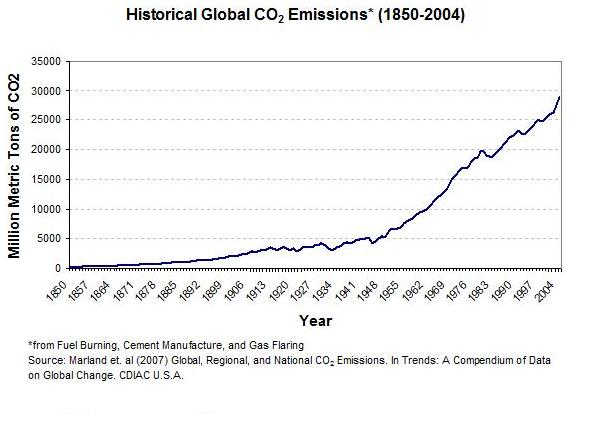
Figure 1. Historical Global CO2 Emissions
Lynn Anderson
Terry Anderson
Authors
Lynn Anderson is a research assistant at the Centre for Distance Education, Athabasca University. Correspondence regarding this article can be sent to: lynnlo@cogeco.ca
Terry Anderson is a professor and Canada Research Chair in Distance Education, Centre for Distance Education, Athabasca University.
Abstract: In order to stay current within their field, many professionals regularly attend conferences and training events in distant locales. Travel to these conferences costs professionals, and their sponsor organizations, both time and money. In the past the benefits afforded by these conferences, and the lack of comparable alternatives, have provided justification for these expenditures. However, recent studies have shown that the cost of travel extends beyond the pocketbook. Transportation is a major contributor of carbon dioxide (CO2) emissions, a key suspect in the argument for the negative impact of global climate change. This paper examines the potential effects of travel to these conferences on the environment and promotes online conferences as a comparable alternative to face-to-face events. A successful online conference is used to demonstrate the magnitude of the environmental and economical benefits of online conferences. The authors posit that online conferencing technologies have evolved such that they now offer another option for professional development that is effective, economical and environmentally friendly.
Résumé : Afin de rester à jour dans leur domaine, de nombreux professionnels participent régulièrement à des colloques et à des activités de formation dans des endroits éloignés. Se déplacer pour assister à de tels congrès ou colloques demande des investissements à la fois en temps et en argent de la part des professionnels et de leurs établissements parrains. Si, par le passé, les bénéfices que procuraient ces colloques et l’absence de solutions de rechange comparables justifiaient de telles dépenses, des études récentes ont toutefois montré que les frais de déplacement s’étendent au-delà des coûts financiers. Les transports constituent une source majeure des émissions de dioxyde de carbone (CO2), un composé soupçonné d’être l’un des facteurs clés de l’impact négatif de l’humain sur le changement climatique mondial. Le présent article examine les effets potentiels des déplacements à de tels colloques sur l’environnement et fait la promotion des activités de formation en ligne comme solution de rechange comparable à des événements auxquels on doit assister en personne. Une activité de formation en ligne réussie est exploitée afin de démontrer l’ampleur des avantages environnementaux et économiques que présentent les formations en ligne. Les auteurs postulent que les technologies de conférence en ligne ont évolué de telle sorte que ces dernières représentent dorénavant une nouvelle manière de suivre des activités de perfectionnement professionnel, en plus d’être une option efficace, économique et écologique.
The face-to-face professional conference or training session is the most common and most costly form of professional education. Social disruption, direct financial, and most recently environmental costs associated with this model of professional development are large and growing. The travel required to attend international conferences produces considerable greenhouse gas emissions. Greater awareness of the negative environmental effects of travel as well as the recent economic downturn has prompted governments, businesses, professional organizations and institutions to re-examine their travel policies. The Globe and Mail (October 24, 2008) concludes that although many organizations are looking to reduce both their budgets and their carbon footprint, they are unsure as to how to proceed. Many do not yet understand the impact of business travel on the environment, are uncertain as to how to implement an effective yet environmentally sensitive travel program (Belford, 2008) and do not appreciate the distributed online conference alternative.
The purpose of this article is twofold. First, the authors hope to raise awareness of the costs and negative impact of business travel on the environment and particularly that travel associated with professional development activities by reviewing recent literature on climate change. Second, the authors describe and endorse online conferences as an effective, economical, and environmentally friendly alternative to traditional place-based professional development conferences. Although many organizations and individuals already utilize online communications platforms to enable meetings, very few have promoted online conferences as an alternative to face-to-face professional development conferences which often require travel by hundreds of participants. The authors demonstrate the environmental and economic benefits of large-scale online conferences by estimating the carbon footprint savings and the fiscal savings of participants attending an online professional development conference. It is argued that online conferences provide an attractive cost and environmental alternative to face-to-face professional development conferences.
One can hardly open a newspaper or magazine these days without reading the phrase ‘carbon footprint’. The phrase evolved from discussions on the ‘ecological footprint’ and gained popularity in 2005 when BP, one of the world’s largest energy corporations, ran an enormous media campaign challenging individuals and organizations to reduce their ‘carbon footprint’ (Safire, 2008). But, what is a carbon footprint? The carbon footprint is a measure of the impact that human activities have on the environment in terms of carbon dioxide emissions (ISA, 2007). This definition includes activities of individuals, populations, governments, companies, organisations, and industries.
Carbon dioxide (CO2) emissions, measured in units of tonnes (metric tons) or kilograms, are mainly produced through the burning of fossil fuels to produce electricity and heating, and to power transportation. These emissions, which make up approximately 85% of all greenhouse gases (GHG), have been increasing at a staggering rate (see Figure 1). Rising atmospheric concentrations of CO2 have been blamed for climate changes observed over the last fifty years, specifically global warming (IPCC, 2007). In addition, many climate scientists have warned that if CO2 concentrations continue to rise, the resulting climate changes could be substantial and irreversible (Hansen, 2006; Rosenthal & Revkin, 2007; Solomon, Plattner, Knutti & Friedlingstein, 2009). Although some of the science on climate change (and climate scientists) have come under recent criticism (Pearce, 2010; Wente, 2010), many governments, organizations, and businesses remain dedicated to the reduction of CO2 emissions. In Europe, there has been a series of directives aimed at limiting and reducing CO2 emissions through the establishment of a European Union Greenhouse Gas Emissions Trading System (EU ETS); while in the U.S., the Environmental Protection Agency (EPA) announced in December, 2009, that it will start enforcing strict carbon controls.
Figure 1. Historical Global CO2 Emissions
One of the ways in which governments, businesses and organizations have chosen to reduce greenhouse gas emissions is through the adoption of sustainable transportation policies. Air travel alone causes the release of more than 600 million tonnes of CO2 emissions each year (Kim et al., 2007), and the IPCC estimates that by 2050, emissions from global air travel will account for 5% of all emissions around the world. However, scientists point out that aircraft impact the climate in many ways beyond CO2 emissions. “They emit nitrogen oxides which produce ozone, a particularly effective greenhouse gas at cruising altitudes” (Stohl, 2008). In addition, aircraft also contribute to the greenhouse effect by emitting water vapour and sulphates and producing contrails (Declan, 2010; Marquart, Ponater, Mager & Sausen, 2003). Consequently, the impact of air travel on climate change is much greater than measurements of CO2 emissions alone would indicate. Some scientists estimate that the impact may be as much as double that of CO2 emissions alone (Stohl, 2008).
The Globe and Mail (October 24, 2008) addressed the environmental impact of business travel and listed a handful of companies across Canada beginning to incorporate eco-friendly travel policies. This movement has been bolstered by the recent economic downturn. Reducing business travel not only helps the environment, it trims the budget. Consequently, many organizations are “looking to replace some forms of business travel with technological equivalents such as video and teleconferencing” (Belford, 2008). Many have already done so by incorporating online collaborative technologies to reduce travel to meetings. However, few have expanded their use of these technologies to large scale meetings, and fewer still have encouraged the use of online conferencing for the purpose of professional development. The professional development conference has, for decades, been encased in a static model where hundreds of participants travel to a central venue and sit through didactic presentations. For environmental, economical and pedagogical reasons, it is time to think outside of the box.
Online Professional Development (PD) conferences have existed for over a decade and have been employed, predominantly, by higher education professionals. Early online conferences utilized mailing lists to connect presenters to participants (Anderson, 1996). More recently technological advances and increasing accessibility to high bandwidth have led to dramatic improvements in online conferencing technology. Many conferencing platforms now offer an abundance of features that enable multimedia interactivity, both synchronous and asynchronous, between participants and presenters. These scalable platforms can accommodate hundreds of people around the world simultaneously. The newest of these platforms utilize multi-user virtual environments (MUVEs). These highly graphical 3-D virtual environments allow presenters and participants to attend conferences through their self-created digital characters or ‘avatars’. Participants can interact not only with the designed environment, but with other participants’ avatars as well (Steinkuehler, 2004). Web 2.0 technologies such as blogs, wikis, twitter and social networks have also added to the interactive and social capabilities of online conferencing.
One of the longest running online conferences to date, is the Technology, Colleges and Community (TCC) Worldwide Online Conference. This annual conference, which began in 1996, takes place entirely online over the course of three days (24 hours/day). It has evolved to include many of the technologies described above, and in 2008, the TCC conference attracted over 800 participants from around the world. Another successful online professional development conference is the International Online Conference (IOC) for Teaching and Learning (formerly the Illinois Online Conference). In 2008, this conference ran for the sixth consecutive year and attracted over 300 delegates. These conferences (and resultant participant satisfaction reports) demonstrate that online conferences can be an effective alternative to face-to-face professional development events (Kimura & Ho, 2008).
In recent years, some professional organizations, in an attempt to broaden their audience and improve accessibility, have offered dual mode conferences. These face-to-face conferences are complemented with a simultaneous online conference. Live or recorded presentations are streamed to online participants. Interaction takes place during the live presentation via an on-site moderator, or following the presentation in online discussion forums. The added cost of organizing and producing the online portion of the conference may be reconciled through registration fees for online participants or corporate sponsorship. Registration for the online portion of the conference is usually much reduced, if not free, creating a fiscal as well as environmentally attractive alternative. One example of a successful dual mode conference is Exeter Online, which ran in conjunction with the 42nd International Annual IATEFL (International Association of Teachers of English as a Foreign Language) conference in Exeter, England (British Council, 2008). The IATEFL conference attracted approximately 1400 delegates to the venue in Exeter, while the online conference attracted almost 4000 participants from 112 countries (G. Dudeney, personal communication, April 30, 2008). The Exeter Online conference was offered free of charge, whereas the live conference fees ranged from £95 (student IATEFL members) to £210 (non-members, late registration). These fees did not include food or accommodations (IATEFL, 2008).
As online conferences have evolved, the advantages that they afford have become more apparent. These advantages have been touted by both conference organizers and participants (Anderson, 1996; Kasser, 2001; Wang, 1999). Although this paper focuses on the environmental and fiscal benefits, it is important to describe some of the affordances that make online conferences an effective medium for professional development. If not effective, all other benefits are moot. The most important of these advantages is the interaction afforded by online conferencing. It has been argued that both the quantity and quality of interaction in the formal part of an online conference can be better than that experienced in a face-to-face conference (Minshull, 2006; Wang, 1999). Many online conferencing platforms now support synchronous communication via text chat, teleconferencing and VoIP. However, asynchronous communication remains popular as it alleviates the problems resulting from differing time zones and schedules.
Asynchronous interaction presents another advantage of online conferencing - accessibility. Online conferences mitigate many of the barriers faced by professionals who, for a variety of reasons, are unable to leave their work or home life in order to attend continuing education programs. Asynchronous conferencing platforms and recorded presentations allow these participants temporal flexibility as well as geographic independence. In addition, most online professional development conferences remain archived long after the proceedings have ended, providing participants with a record of presentations, shared information, and discussions. In some cases, these discussions do not end with the conclusion of the proceedings. Continued online communities of practice are often encouraged between participants that are separated by geographical and temporal distances (Anderson, 1996; Dolezalek, 2003; Wenger, McDermott & Snyder, 2002).
The accessibility of online conferences is further enhanced by its low cost. Online conferences allow participants to avoid not only the expense of transportation and accommodations, but also the opportunity cost of time away from work while travelling. In addition, the cost of registration in an online conference is usually much less than that of a face-to-face conference. This is particularly true when the conference is held completely online as there is no need for organizers to provide a physical venue, printed materials, or travel costs for speakers. These savings translate to much reduced, if not free, conference registration for participants.
However, these advantages can be offset by perceptions of lower quality and the challenges of “continuous partial attention” (Stone, 2007). The prevalence of low cost and accessible communications devices results in increased multi-tasking that may induce online conference participants to pay only partial attention to screen based proceedings as they juggle activities and responsibilities at home or office. For many the removal from the workplace that associated travel to a face-to-face conference provides opportunity to ignore home responsibilities and more completely immerse oneself in the flow of the conference. However, it should also be noted that the accessibility of wireless connectivity at most conference venues allows opportunity (to which many avail themselves) to pay only partial attention to face-to-face conference proceedings as well. Finally, the spontaneous and random socializing and networking that can happen at social activities or before and after conference activities may be inhibited or even eliminated by online participation. The participation in social software networks such as Linkedin or equally spontaneous conversations in immersive (SecondLife) or chat environments however may partially mitigate these challenges.
In sum, an online conference is not the same as a face-to-face conference. Like any media shift, it affords advantages and disadvantages. Assessing and re-assessing these advantages in response to changing economic and environmental conditions is thus an important function of all professionals and their organizations. We next turn to means to quantify the environmental and economic differences between online and face-to-face conferences.
To quantify advantages of online conferences we provide an example of the average carbon footprint participants in an online conference would have created, had the conference taken place at a face-to-face venue. In addition, we provide an estimate of the associated monetary costs to participants for such a conference.
The conference selected for this purpose was the “Supporting Deaf People Conference 2008” (SDP), hosted by Direct Learn Services. In February of 2008, the conference ran for the sixth time in eight years and drew 241 presenters and participants from 18 countries. This conference was chosen as it took place entirely online and attracted delegates from around the world. In addition, the SDP conference is recognized by both the Register for Interpreters for the Deaf (RID) in the USA and Association of Visual Language Interpreters of Canada (AVLIC), such that attendance at this online conference is considered acceptable professional development for the maintenance of certification with both of these national organizations. Finally, the longevity of this conference and the positive feedback offered by participants give witness to the value it provides (Direct Learn, 2008).
The SDP online conference includes two themes that are discussed over the course of four days (24 hours/day). The presentations are usually pre-recorded and come in a variety of formats including:
These pre-recorded presentations are loaded on to the conference website and made available to participants a week prior to the actual conference start date. In so doing, the conference organizers allow delegates ample opportunity to familiarize themselves with the content before engaging in the discussion (J. Mole, interview, September 17, 2008). In 2008, the conference organizers also experimented with using a synchronous conferencing platform, Wimba. In this live audio session, the presentation was signed in a separate window in American Sign Language. It should be noted, that the conference organizers must not only make the conference accessible to non-hearing people, but they also have to accommodate an audience that uses more than one form of sign language. These sign languages are very different and often “mutually unintelligible” (Wikipedia, 2009a).
The organizers of the SDP conference are based in London, England, and a large portion of the presenters and participants were from the UK, Europe, Africa and the Middle East. So, for the purpose of this paper, we will assume that had this conference been hosted at a face-to-face venue, that venue would have been located in London, England. In order to provide a moderate estimate of the carbon footprint and financial cost of this conference, we will assume that participants travelling to London would require accommodations for only three nights at a hotel. This duration is consistent with many traditional face-to-face conferences.
The method used for estimating the carbon footprint savings of this conference has been adapted from a study done at the Norwegian Institute for Air Research (Stohl, 2008). This study estimated the CO2 emissions associated with business travel undertaken by employees of the institute during the years 2005-2007. As in that research study, the calculations of the carbon footprint savings of the SDP Online Conference will be based on emissions caused by air travel, ground transportation and hotel use. Other sources of emissions (e.g., related to food consumption, purchase of goods, use of conference facilities and materials, etc) will be omitted, assuming that they are either negligible or would have occurred in any case.
The names of the towns, cities and countries which the presenters and participants called home were provided by Direct Learn. In estimating the carbon dioxide emissions resulting from travel to London, England, it was assumed that participants within England and Wales would either drive or take the train. In calculating the emissions that might result from this travel an extremely conservative value of 0.08 Kg CO2/Km was estimated. Travel from all other countries includes air travel into London Heathrow Airport. Departure points for those participants flying to London, England, were taken to be the international or regional airports closest to the participants’ homes. These airports were found using both Wikipedia online encyclopedia and Google maps.
There are many online calculators available that provide an estimate of CO2 emissions for flights between given airports. However, the results from these online calculators vary greatly. Not surprisingly, the results often favour the commercial or political agenda of the supporting website. Carbon calculators provided by sites that are affiliated with the air travel industry give low emission results whereas calculators provided by sites that are affiliated with environmental protection or carbon offset programs give higher emission results. In addition, some online calculators take into account the magnification of the effects of carbon emissions at high altitudes whereas others do not. For the purpose of this paper, we chose to apply Stohl’s (2008) equations for calculating the CO2 emissions of return flights between participants’ nearest airport and London Heathrow International Airport. The CO2 emissions calculated for four different return flights to Heathrow using Stohl’s equations were compared to results from seven different online CO2 emission calculators. The estimations resulting from Stohl’s equations were consistently lower than the average of the emissions found using the online calculators. Consequently, it is believed that Stohl’s equations provide a moderate estimate of the carbon dioxide emissions that would result from air travel to and from the conference.
For every flight into London, carbon dioxide emissions resulting from 60km of ground travel were calculated and added to the flight emissions to provide total CO2 emissions for the round trip. This distance was assumed to represent a modest estimate of the return car trip from a participant’s home town to the nearest airport. Emissions for this private automobile ground travel were estimated at 0.13 Kg CO2/ Km, again, a very conservative figure (Vehicle Certification Agency, 2008). Car travel within London was not included as the city provides excellent rapid transit to most hotels and tourist locations.
As Stohl points out, “CO2 emissions occur also during the stay in a hotel, for instance due to heating or hot water preparation,” (2008, p. 6501). To estimate the CO2 emissions from three nights of accommodations in London, we used Stohl’s measurement of 12 kg CO2 per visitor night. Stohl arrived at this figure by averaging estimations for CO2 emissions per visitor night in hotels in Europe and Australia. It was assumed that participants whose homes were within a 200km radius of London would return there each evening. Consequently, it was estimated that these participants would generate zero additional emissions from hotel stays.
The cost of this conference for participants travelling to London by air was based on the following expenditures:
The cost of meals was not included although this expenditure would most likely be much greater than the amount spent on food had the participant remained at home.
It was assumed that participants would either take a taxi to the airport nearest their home or park their own automobiles at the airport. The approximate cost for either of these choices was estimated to be $50 USD. Airfares for over a dozen different return flights to London in March, 2009, were found on Expedia.com, using the lowest possible price given for the most direct flights between participants’ nearest airport and London Heathrow. These flights represented a variety of distances and originated in many different countries. From this sample, the average airfare per kilometre was estimated at $0.08 USD. Likewise, the average cost of hotel accommodations was based on the ‘Expedia.com special rate’ for single occupancy at hotels ranked three stars or better in central London. The cost of return transportation from Heathrow to London was estimated at $30/participant assuming that participants would choose to take one of the mass public transport options available at Heathrow (Londontoolkit, 2009). Finally, the registration cost of this conference, had it taken place at a face-to-face venue, was estimated using the average cost of actual two to four day conferences in related fields found using Google.
The cost of this conference for participants travelling to London from within England or Wales was based on the following expenditures:
It was assumed that most participants living in England and Wales would choose to take the train into London. The National Rail Online Journey Planner was used to estimate the average price per kilometre ($0.61/km) for train travel to London (National Rail, 2009). The prices used were those quoted as the “Cheapest Available Fare” between a given city and London, departing Sunday afternoon and returning Wednesday evening. The average price per km was then used to calculate the average cost of return travel by train to the conference. Hotel accommodations for participants living within a 200km radius of London were not included in the calculations as it was assumed that these participants would return home each evening. However, the return travel costs for these participants were multiplied by three to account for the extra train travel each day.
The environmental and fiscal cost of attending this conference, had it taken place in London, would have been substantially higher for those participants travelling by air. In order to provide a fair and comprehensive representation of the estimated CO2 emissions and fiscal costs of attending a face-to-face conference, the results have been organized into three sections:
Table 1 summarizes the CO2 emissions that would have been contributed by participants who travelled to London via air. In order to provide a broad picture of the environmental impact of travel, this table includes the total emissions resulting from return air travel, ground transportation to and from airports, and hotel accommodations for three nights. Table 2 provides estimates of the average costs that would have been incurred by participants travelling to London by air.
Table 1. Carbon dioxide emissions resulting from participants travelling to London via air, expressed in metric tons (tCO2)
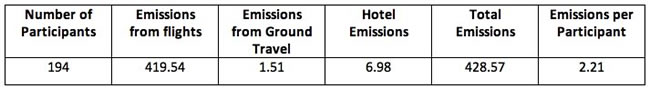
Table 2. Average costs incurred by participants flying into London (USD)
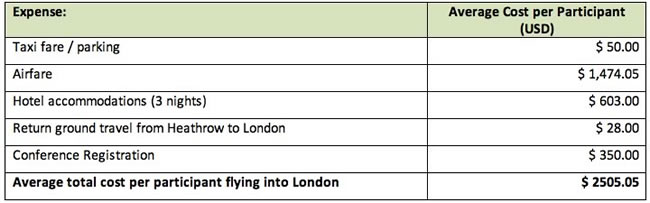
Table 3 summarizes the CO2 emissions that would have been contributed by participants travelling to London from within England and Wales. As in Table 1, total emissions resulting from ground transportation and hotel accommodations for three nights have been included. Table 4 provides estimates of the average costs that would have been incurred by this group of participants.
Table 3. Carbon dioxide emissions resulting from participants travelling to London via car or rail, expressed in metric tons (tCO2)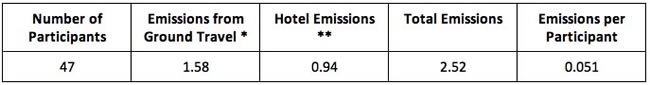
* Only 37 of these participants were estimated to require ground travel to the conference as ten lived within London.
** Only 26 of these participants were estimated to require hotel accommodation as they lived more than 200km from London.
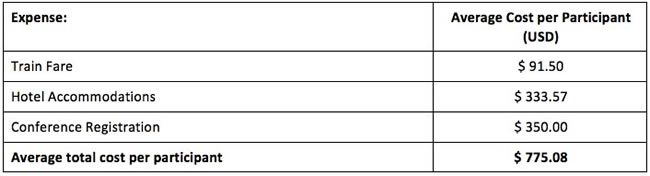
Table 4. Average costs incurred by participants travelling from within England and Wales (USD)
The average CO2 emissions, that would have resulted from the SDP conference, had it been held in London, England, are provided in Table 5. The average costs incurred by participants are displayed in Table 6.
Table 5. Total carbon dioxide emissions resulting from the SDP Conference had it been held in London, England, expressed in metric tons (tCO2)
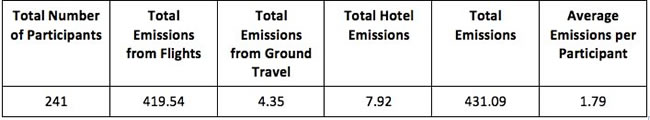
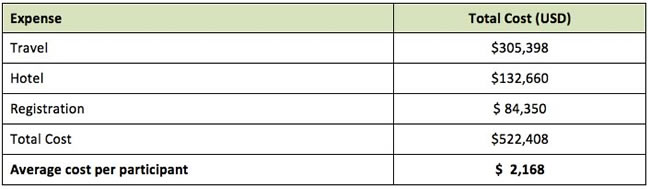
Table 6. Total costs incurred by participants attending the SDP if it had taken place in London, England (USD)
As stated previously, all of the estimations and assumptions used to calculate the CO2 emissions and costs for this conference were chosen so that the results would provide a moderate estimate of the environmental and economic savings of participants at the SDP 2008 online conference. Stohl (2008) chose the various parameters in equations (1) and (2) “such that the CO2 emission estimates are thought to be conservative”. Likewise, the authors used the lowest prices quoted for timely travel to London and reasonable accommodations in order to provide a very modest estimate of the costs that would be incurred by participants. Consequently, these results are more likely to be an underestimation than an overestimation.
The carbon footprint saved, or avoided, by holding this conference online was 431.09 metric tons of CO2. Approximately 97% of these emissions were caused by air transportation. To put these numbers in perspective, Table 7 compares the per capita CO2 emissions of this conference with annual per capita emissions of various countries around the world. This data was retrieved from the Carbon Dioxide Information Analysis Center (CDIAC), the primary climate-change data and information analysis center of the U.S. Department of Energy (DOE). The table below includes the CDIAC’s ranking of the top 211 CO2 emitters per capita.
Table 7. Comparison of CO2 emissions saved per capita by the SDP conference with the annual per capita emissions of various countries in 2005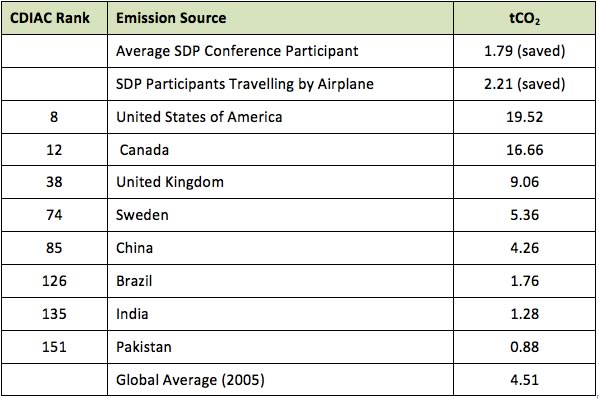
[Source: Carbon Dioxide Information Analysis Center (CDIAC, 2009)]
From this table, we can see that had the SDP conference taken place in London, England, instead of online, the per capita emissions would have been greater than the per capita emissions of Brazil for all of 2005. In fact, the per capita emissions for this one conference, taking place over three days, would have been greater than the per capita emissions of at least 86 different countries for the entire year of 2005. However, many scientists believe that the impact of air travel on the environment is much greater than indicated by CO2 emissions alone (Marquart et al., 2003). Consequently, the environmental impact of flights to London may be much greater than these results would suggest.
The fiscal cost of attending a face-to-face conference is no small expense. As demonstrated here, the average financial cost to participants, or the organizations supporting them, may be well over $2000.00 USD. This figure does not include the added expense of meals at restaurants, nor does it take into account the lost work hours and opportunity cost while travelling. For those individuals and organizations concerned with the environmental impact of attending a face-to-face conference, there may also be the added expense of carbon offsets. Carbon offsets may be purchased by individuals and organizations so that the carbon emissions they have produced are equivalent to the carbon savings that have been generated elsewhere. Carbon offsets typically involve investments in renewable energy, energy efficiency, and reforestation projects. This “net zero carbon footprint” is also referred to as “carbon neutrality” (Wikipedia, 2009a). Companies that provide carbon offsets vary widely in their price per metric ton of CO2, averaging approximately $20 USD (EcoBusinessLinks, 2009). At this rate, the average cost of carbon offsets for participants attending the SDP conference in London would have been approximately $36 USD. This may seem like a relatively inexpensive price to pay for an environmentally clean conscience. However, carbon offsetting companies have been criticized for misleading the public into a false sense of carbon neutrality (Gillenwater, Broekhoff, Trexler, Hyman & Fowler, 2007; Schmidt, 2009). The authors recommend carbon offsetting only after all other means of reducing carbon emissions have been exhausted and following careful investigation of certified carbon offset providers.
In stark contrast to the expenses listed above, the 2008 SDP Online conference cost participants a total of 50£, equivalent to $69 USD at time of writing. This registration fee covered all of the costs for this quality professional learning opportunity, over four days. These included the cost of the platform, stipends for presenters, and the services of Direct Learn. No other costs were incurred by the participants.
Reducing the carbon footprint has become an international goal for most countries and a personal goal for many. Corporations, governments, professional organizations, and individuals all have a role to play. One highly effective means to achieving this goal is the reduction of unnecessary travel. Air travel has been shown to be a major contributor of carbon dioxide emissions, and most scientists believe that current estimations of the impact of air travel on our environment are gross underestimations. Despite these assertions, every year, professional associations organize conferences to which thousands of participants fly to attend; every year, corporations send their employees to central locations for training; and every year professionals choose to attend international conferences that require distant travel.
As can be seen from the results above, the carbon footprint left by travel to these professional development events is considerable. One participant, travelling by air to a single conference, produces more CO2 emissions than many countries produce per capita in a year. Finally, direct costs were reduced by more than an order of magnitude - from over $2,000 to $69 USD. Today, interactive technologies have evolved to a point that travel to many conferences and training programs is unnecessary or could easily be substituted (at least part of the time) by the use of telecommunications technologies. Online conferences offer an environmentally friendly alternative that has been shown to be both effective and economical. Organizations trying to implement environmentally friendly travel policies are encouraged to utilize these technologies to replace or supplement face-to-face professional development events. Individuals looking to improve their skills through continuing education are urged to avoid air travel by choosing, whenever possible, professional development conferences offered online.
Anderson, T. (1996). The Virtual Conference: Extending professional education in cyberspace. International Journal of Educational Telecommunications, 2(2/3), 121-135. Retrieved May 21, 2001, from: http://www.ascusc.org/jcmc/vol3/issue3/anderson.html
Belford, T. (2008, October 24). Adapting to an eco-friendly itinerary. Globe and Mail. Retrieved Oct. 25, 2008, from: http://www.theglobeandmail.com/
British Council (2008). Exeter Online. Retrieved March 17, 2008, from http://exeteronline.britishcouncil.org/
CDIAC. (2009). 2005 per capita Fossil Fuel CO2 Emission Rates. Retrieved Feb. 3, 2009, from http://cdiac.ornl.gov/trends/emis/top2005.cap
Declan, D. (2010). Flight risk aviation looks to mitigate carbon emissions. Engineers Journal 64 (1), p56-58.
Direct Learn. (2008). Supporting Deaf People 2008. Retrieved Sept. 6, 2008, from http://www.online-conference.net/sdp2008.htm
Dolezalek, Holly. (2003). Collaborating in cyberspace. Training 40(4), 32-37.
EcoBusinessLinks (2009). Carbon Emission Offset Directory. EcoBusinessLinks.com. Retrieved march 9, 2009, from http://www.ecobusinesslinks.com/carbon_offset_wind_credits_carbon_reduction.htm
Expedia. (2009). Expedia.com. Retrieved February 27, 2009, from http://www.expedia.com/default.asp?rfrr=-1065&mcecid=ipsplash_ca
Gillenwater,M., Broekhoff, D., Trexler, M., Hyman, J., & Fowler, R. (2007). Policing the voluntary carbon market. Nature Reports Climate Change Nov, 2007. Retrieved March 6, 2009, from http://www.nature.com/climate/2007/0711/full/climate.2007.58.html
Hansen, J. E. (2006) October 17). Can we still avoid dangerous human-made climate change? Social Research: An International Quarterly of Social Sciences , pp. 949-974.
IATEFL (2008). Exeter 2008 – IATEFL Annual conference and Exhibition. Retrieved March 17, 2008, from http://www.iatefl.org/content/conferences/2008/index.php
IPCC (2007). Summary for Policymakers. In: Climate Change 2007: The Physical Science Basis. Contribution of Working Group I to the Fourth Assessment Report of the Intergovernmental Panel on Climate Change [Solomon, S., D. Qin, M. Manning, Z. Chen, M. Marquis, K.B. Averyt, M.Tignor and H.L. Miller (eds.)]. Cambridge, United Kingdom and New York, NY, USA: Cambridge University Press..
ISA Research & Consulting. (2007). A Definition of "Carbon Footprint". (Research Report). Durham, UK: Wiedmann, T., & Minx, J. Retrieved Nov. 24, 2008, from http://www.censa.org.uk/reports.html
Kasser, J. (2001). Enhancing conferences and symposia using web based asynchronous techniques. The 11th International Symposium of the INCOSE, Melbourne, Australia. Retrieved September 26, 2007, from http://www.unisa.edu.au/seec/pubs/01papers/enhancing%20webconf.pdf
Kim, B. Y., Fleming, G. G., Lee, J. J., Waitz, I. A., Clarke, J.-P., et al. (2007). System for assessing Aviation’s Global Emissions (SAGE), Part 1: Model description and inventory results, Transportation Research Part D-Transport and Environment 12, 325–346.
Kimura, B., & Ho, C. (2008). Online conferences and workshops: Affordable & ubiquitous learning opportunities for faculty development. Distance Learning and Internet Conference 2008 (pp. 61-65). Tokyo: Waseda University. Retrieved March 4, 2009, from http://www.waseda.jp/DLI2008/program/proceedings/pdf/session3-1.pdf
Londontoolkit. (2009). Heathrow to Central London Transfer Choices. Retrieved February 27, 2009, from http://www.londontoolkit.com/travel/heathrow_central_london.htm
Marquart, S., Ponater, M., Mager, F., & Sausen, R. (2003). Future development of contrail cover, optical depth, and radiative forcing: Impacts of increasing air traffic and climate change. Journal of Climate, 16 , 2890-2904.
Minshull, G. (2006). Evaluation Report Highlights, Innovating e-Learning 2006 Online Conference. Retrieved on August 30, 2007, from http://www.jisc.ac.uk/uploaded_documents/evaluation%20highlights%20innovating%20e-learning%202006.doc
National Rail. (2009). National Rail Enquiries. Retrieved February 27, 2009, from http://www.nationalrail.co.uk/
Pearce, F. (2010, March 2). Climategate scientist questioned in Parliament. New Scientist. Retrieved March 2, 2010 from: http://www.newscientist.com/article/dn18599-climategate-scientist-questioned-in-parliament.html
Rosenthal, E. & Revkin, A.C. (2007, February 3). Science Panel Calls Global Warming ‘Unequivocal’. The New York Times. Retrieved Nov. 26, 2008, from http://www.nytimes.com/2007/02/03/science/earth/03climate.html
Safire, W. (2008, February 17). On Language: Footprint. The New York Times. Retrieved Nov. 25, 2008, from http://www.nytimes.com/2008/02/17/magazine/17wwln-safire-t.html
Schmidt, C.W. (2009). Carbon Offsets: Growing Pains in a Growing Market. Environmental Health Perspectives 117 (2). P. A62 (7).
Solomon, S., Plattner, G-K., Knutti, R. & Friedlingstein, P. (2009). Irreversible climate change due to carbon dioxide emissions. Proceedings of the National Academy of Sciences of the United States of America (PNAS) 106 (6), 1704-1709.
Steinkuehler, C. (2004). Learning in massively multiplayer online games. Proceedings of the 6th International Conference on Learning Sciences. Retrieved October 28, 2007, from http://www.academiccolab.org/resources/documents/SteinkuehlerICLS2004.pdf
Stohl, A. (2008). The travel-related carbon dioxide emissions of atmospheric researchers. Atmospheric Chemistry and Physics 8, 6499-6504. Retrieved December 16, 2008 from http://www.atmos-chem-phys.net/8/issue21.html
Stone, L. (2007). Retrieved March 5, 2009, from Linda Stone's Thoughts on Attention and Specifically, Continuous Partial Attention: http://www.lindastone.net/
Vehicle Certification Agency (2007). Car Fuel Data Booklet 2007. VCACarFuelData.org.uk: Website of the Vehicle Certification Agency [online]. Accessed on Feb. 2, 2009 from http://www.vcacarfueldata.org.uk/index.asp
Wang, Y. (1999). Online conference: A participant’s perspective. THE Journal (Technological Horizons in Education) 26(8), 70.
Wenger, E., McDermott, R. A., & Snyder, W. (2002). Cultivating communities of practice: A guide to managing knowledge. Boston: Harvard Business School Press.
Wente, M. (2010, February 5). The great global warming collapse. The Globe and Mail. Retrieved March 2, 2010, from: http://www.theglobeandmail.com/news/opinions/the-great-global-warming-collapse/article1458206/
Wikipedia (2009a). Carbon Neutrality. Wikipedia: The Free Encyclopedia. Retrieved March 6, 2009, from http://en.wikipedia.org/wiki/Carbon_neutrality
Wikipedia. (2009b). Sign Language. Wikipedia: The Free Encyclopedia. Retrieved March 06, 2009, from http://en.wikipedia.org/wiki/Sign_language#Sign_languages.27_relationships_with_oral_languages