Introducing laptops to children: An examination of ubiquitous computing in Grade 3 reading, language, and mathematics
Canadian Journal of Learning and Technology
Volume 33(3) Fall / automne 2007
Introducing laptops to children: An examination of ubiquitous computing in Grade 3 reading, language, and mathematics
Robert M. Bernard
Edward Clement Bethel
Philip C. Abrami
C. Anne Wade
Authors
Robert M. Bernard, Professor, Centre for the Study of Learning and Performance, Concordia University, Montreal, QC. Correspondence regarding this article can be sent to: bernard@education.concordia.ca
Edward Clement Bethel, Doctoral Student and Research Assistant, Centre for the Study of Learning and Performance, Concordia University, Montreal, QC. He can be reached by e-mail at: e_bethel@education.concordia.ca
Philip C. Abrami, Professor and Director, Centre for the Study of Learning and Performance, Concordia University, Montreal, QC. He can be reached by e-mail at: abrami@education.concordia.ca
C. Anne Wade, Information Specialist, Centre for the Study of Learning and Performance, Concordia University, Montreal, QC. She can be reached by e-mail at: wada@education.concordia.ca
Abstract
Abstract: This study examines the achievement outcomes accompanying the implementation of a Grade 3 laptop or so-called ubiquitous computing program in a Quebec school district. CAT-3 reading, language, and mathematics batteries were administered at the end of Grade 2 and again at the end of Grade 3, after the first year of computer implementation. Overall gain was found in all three content areas, but was differential when compared with the norms of the CAT-3. Additionally, some evidence suggested a differential gain for lower and middle-level learners during the school year. Teachers were administered an instrument called the Technology Implementation Questionnaire (TIQ) that assessed the purposes and extent of technology integration. Negative correlations were found in reading achievement gain for items associated with the higher use of communicative, evaluative, and creative uses of computers. Open-ended teacher responses indicated the need for more professional support for instructional implementations of computing.
Résumé: Cette étude examine les performances accompagnant l’implantation d’un programme d’ordinateurs portables en 3 ième année du primaire, aussi appelé programme d’ubiquité computationnelle, dans une école d’un district scolaire du Québec. Des batteries de tests, CAT-3 en lecture, en langue et en mathématiques ont été administrées à la fin de la deuxième année du primaire et une autre fois à la fin de la troisième année du primaire, après un an d’implantation des ordinateurs. Un gain fut observé dans les trois matières, mais était différencié lorsque comparé aux normes du CAT-3. De plus, un gain différencié fut mis en évidence pour les apprenants de niveau inférieur et moyen durant l’année scolaire. Les enseignants ont rempli le Technology Implementation Questionnaire (TIQ) qui mesure le but et l’étendue de l’intégration technologique. Des corrélations négatives ont été trouvées en gains au niveau de la lecture pour les items associés à l’utilisation de haut niveau des ordinateurs, en communication, en évaluation et en création.
Introduction
Critics of technology integration in the classroom (e.g., Cuban, 1986; Oppenheimer, 2003) point to the now famous and admittedly laughable 1922 quotation by Thomas Alva Edison (“I believe that the motion picture is destined to revolutionize our educational system and that in a few years it will supplant largely, if not entirely, the use of textbooks.”) as evidence of unbridled, yet failed enthusiasm for technology. Of course it has only partially failed because analog and now digital technologies have and do play prominent roles in elementary and secondary schooling across North America. But 85years later, technology has yet to fully eclipse all of the more traditional educational resources, in particular, the textbook.
The arguments of detractors range from the cost of technology to the lack of incontrovertible research evidence that technology integration leads to better learning and enhanced motivation to achieve (including staying in school). While not new, particularly in postsecondary education, so-called ubiquitous technology integration places a computer in the hands of every student for use at school and at home, on which much of their schoolwork is conducted. So it is an extreme form of technology integration. Presumably, students learn both about the computer (i.e., computer literacy) and with the computer to achieve the traditional goals of literacy and numeracy, as well as those of science, social studies, and the like.
One recent study of ubiquitous computing in a Canadian school district was conducted by Sclater, Sicoly, Abrami and Wade (2006). They report the results of a year-one study of an elementary and secondary laptop initiative (i.e., Grades 3 to 11) in Quebec. In this study, data were collected from 403 elementary and 270 secondary students from the experimental school board, as well as from 330 students in a control school board. In addition, questionnaire data were collected from 60 elementary school teachers and 51 secondary school teachers. Finally, interviews were conducted with 72 students and 20 teachers. The most potentially interesting finding was the difference in mean achievement scores between the experimental and control boards. Secondary students from the experimental board had higher scores on the CAT-3 reading test and reported six times more frequent use of computer technology in their English classes, suggesting a possible treatment effect. In contrast, mathematics scores were higher at the control board where neither board indicated high levels of computer use. The authors warn that the findings be interpreted with caution because of threats to internal validity due to selection bias. The following is a synthesis of the majority of research surrounding this developing educational phenomenon.
Synthesis of Research on One-to-One Laptop Implementations
Until recently, studies of technology integration in schools have reported limited student access to technology in computer labs for select periods during the week, in classrooms where computers are available but at ratios of several students per computer, or even in classrooms using “laptop carts” where a cart with enough laptops for a one-to-one ratio is shared by several classrooms so that students can use their own computers in their own classroom for select periods during the week. Now, interest is shifting to more widespread and ubiquitous technology use, that is, where each student is provided with a computer for use throughout the day. Underpinning this interest is the belief that increased access to technology will lead to increased technology use, which will in turn lead to improvements in a variety of educational outcomes (Russell, Bebell & Higgins, 2004). It is not surprising that particular interest is being given to laptop initiatives where students are allowed to take their computers home.
One-to-one computer implementations that provide students with Internet access and laptop computers for use at school and home are increasing in number. Decreasing hardware costs, increased portability, and availability of wireless networking all contribute to making broad implementations feasible (Penuel, 2006). In two separate research syntheses, Penuel reports that not only does research lag behind such rapid expansion, but few of the research studies that have been done analyze implementation outcomes in a rigorous manner. For this paper we have conducted our own synthesis of one-to-one computing research. Research databases and the Internet were searched for studies on one-to-one computing in elementary or secondary schools that report implementation outcomes. The research we report here is not an exhaustive summary of all the available evidence.
In total, 94 studies were retrieved for review. Not surprisingly, many of these were interim reports of longitudinal studies. Studies of the same implementation were only retained if they studied a unique aspect of that implementation, otherwise only the most recent study was included. Of the 94 reports, 25 presented unique research of implementations and that analyzed implementation outcomes. In addition there were six research syntheses or reviews. These 25 primary studies are synthesized below. The reviews are described separately. All are summarized under headings related to the dependent measures used: 1) Use of Technology; 2) Motivation and Attitude; 3) Technological Literacy; and 4) Student Achievement.
Use of Technology
Although the studies reported on widely different implementations, from small private schools to huge state-wide initiatives, the findings converged around common themes. Implementation goals included increasing technology use, increasing technology literacy, improving quality of teaching and learning, reducing dropout rates/improving attendance, improving motivation and behaviour, and improving academic achievement. Of the stated goals, increased technology use was reported in almost all (22 of 25 or 88%) of the studies. Though this result is not unexpected—the more access to technology, the more opportunities to use it—even this finding is not as straightforward as it first appears. In two of the longitudinal studies (Stevenson, 2004; Newhouse & Rennie, 2001), though initial increases in technology use were reported over time, technology use in one-to-one classrooms declined in use patterns compared to classrooms with shared computers, suggesting that novelty accounts for at least some of the increase in technology use. Moreover, both these studies stress the importance of pedagogy that utilizes the unique contributions of the new technology (Newhouse & Rennie, 2001; Stevenson, 2004). Students quickly become frustrated when new technologies are forced into the same old pedagogy.
Motivation and Attitudes
In a similar vein, the 13 studies (52%) with data on student motivation report increases over previous levels or over non one-to-one comparison groups. Though it is often difficult to identify the proximate cause of student motivation accurately, these findings are certainly encouraging. At the same time, as with technology use, motivational increases may be due to novelty effects. Closely related to both technology use and motivation, 15 studies (60%) reported increases in positive attitudes toward technology. Again, of the six longitudinal studies that report attitudes toward technology, three report that initial differences between the one-to-one and non one-to-one groups declined. Given all these qualifiers, though, one-to-one initiatives have consistently resulted in increased technology use, student motivation, and positive attitudes toward technology.
Technological Literacy
Eleven studies (44%) report findings on technological literacy. Of these, eight report measured increases in technological literacy, while three report perceived increases. Though the number of studies reporting these increases is smaller, given the numbers reporting increased use of technology, it is unsurprising to find corresponding increases in technological literacy. Though improved attendance and discipline were frequently mentioned goals of one-to-one initiatives, these were not often reported in the studies. Only four studies reported attendance figures. Of these, two report dramatic increases while the other two report no difference. Similarly, of the four studies reporting on student discipline, two report improvements while the other two report no difference. Interestingly, though not usually an explicit goal of one-to-one initiatives, improvements in the quality of teacher-student interactions were reported in nine studies. Not only is this important for both motivation and discipline, but these interactions impact directly on pedagogy.
Student Achievement
Justifiably or otherwise, the success of any educational innovation is more often than not evaluated in terms of student achievement gains, usually measured by standardized testing. As far as one-to-one initiatives are concerned, the results are not straightforward. Although in three studies, students or teachers report perceived achievement gains, the actual data paint a more complex picture. In fact, of all the studies, only 14 (56%) report actual achievement data. Of these, six report improvements of some sort. Of these, the relationship between technology and learning cannot be reliably established in two of the studies: one provides no comparison group data and the other provides no pretest data. In contrast to the four that report reliable data on improved achievement, eight studies report no significant difference either between one-to-one and non one-to-one groups or between achievement before and after one-to-one implementations.
This is not to say that one-to-one technology has no effect on student achievement. The studies reporting increases in student achievement all report these increases in particular areas. In their evaluation of the Laptop Immersion Program at Harvest Park Middle School, in Pleasanton, CA, Gulek and Demirtas (2005) found that when achievement results were controlled for prior performance, only differences in Language Arts and Writing remained statistically significant. Similarly, Lowther, Ross, and Morrison (2003) report substantial increases in writing and critical thinking achievement in their evaluation of a one-to-one technology integration using the iNtegrating Technology for inQiry (NTeQ) model. Trimmel and Bachmann (2004), in comparing 27 laptop students with 22 non laptop students, report that significant differences in student achievement could be accounted for by differences found in achievement on only one sub-category—spatial intelligence—of the testing measure used. Particularly interesting is that in three studies, (CRF & Associates, 2003; Mitchell Institute, 2004; Stevenson, 1999), even though none of them reported overall gains for the treatment group as a whole, the authors report that within the treatment groups, low-performing students gained disproportionately.
Russell, Bebell and Higgins (2004) raise another issue. They question whether standardized paper and pencil tests accurately measure the actual learning that might take place in a one-to-one classroom. In particular, they report research where two groups of students, a one-to-one group and a control group, took two versions of the same writing test, a computerized version and paper and pencil version. Predictably, on the computerized version, the one-to-one group had higher scores than they did on the paper and pencil test, while the control group had lower scores than they did on the paper and pencil test. In other words, the unfamiliar test format tended to underpredict the performance of both groups. Moreover, they repeat the oft-heard argument that standardized tests don’t measure the kinds of skills that one-to-one learning may be developing, for example spatial reasoning and problem solving. Though care must be taken with arguments of this sort, the findings of Trimmel and Bachmann (2004) and Lowther et al. (2003) seem to support this line of reasoning.
Research Syntheses
The six research syntheses reviewed echo the findings described above: they report consistent findings of increases in technology use and technology literacy, while reporting little evidence of a “technology effect” on student achievement. The syntheses report several factors contributing to the success of any one-to-one implementation: teacher beliefs, teacher training, technical support, comprehensive curriculum review that meaningfully integrates technology, and change management strategies. Most importantly, though, the syntheses emphasize the need for more research into one-to-one implementations to tease out exactly how, when, and under what conditions they are the most effective.
Summary
Taken together, available evidence of ubiquitous technology integration is consistent—laptop initiatives have shown improvements in technology integration, use and proficiency; attitudes towards technology and the promise of technology for learning; and to some extent increased engagement and motivation. What seems clear, however, is that research does not support the premise that one-to-one initiatives automatically lead to increased student achievement. Of the 25 studies of one-to-one implementations reviewed, 14 provide data on student achievement. Of these, six provide some evidence of achievement gains, four reliably, while eight cite data of no significant difference. Technology seems to be suited to affecting improvements in some areas and with some students more than with others. Moreover, as the results reported in Lowther et al. (2003) seem to suggest, the best results are obtained when one-to-one computing is one part of a well-planned technological integration strategy that includes specific guidelines and training in pedagogically sound uses of computers in the classroom.
The Present Study
In the present study, a one-to-one implementation of laptop computers occurred at the beginning of Grade 3 in a particular Quebec school board. Student achievement in reading, language, and mathematics was measured at the end of grade 2 and again at the end of Grade 3. In addition, Grade 3 teachers filled out the Technology Implementation Questionnaire (reference) to assess their degree of technology implementation in a number of categories of use. The purposes of this study were: 1) to assess the changes that occurred in reading, language, and mathematics between Grades 2 and 3, relative to the published norms of the standardized instrument; 2) to determine if there is a differential relationship between level of achievement (i.e., low and high) change between Grade 2 and Grade3 that might be attributable to the introduction of laptops; and 3) to relate students’ change scores in the three content areas to the levels and types of technology implementation (i.e., what laptops were used to accomplish at what level).
Method
Measures
CAT-3. The Ministry of Education in Quebec (MEQ) does not use a provincial achievement measure for elementary students. A common achievement measure was needed. The Canadian Achievement Test Third Edition (CAT-3) was selected for several reasons, including, but not limited to the following:
- CAT-3 is a well-established, nationally recognized achievement measure;
- The school board had experience with the test, having previously used it;
- The school board had been considering implementing use of the test; and
- To ensure consistency with the Quebec Education Program elementary school curriculum, a test consultant from the Canadian Testing Centre (CTC) conducted a thorough analysis on the Basic Battery to ensure its compatibility.
For the purpose of this evaluation, only the Basic Battery was used for comparing achievement data. The test consisted of a series of multiple-choice questions in reading/language (comprehension, vocabulary, and language) and mathematics (defined by province and test level). CAT-3 national and provincial norms were also made available to the team by the CTC.
TIQ. The Technology Implementation Questionnaire (TIQ) was developed by Wozney, Venkatesh, and Abrami (2006). They used the TIQ to investigate personal and setting characteristics, teacher attitudes, and current computer technology practices among 764 elementary and secondary teachers from both private and public school sectors in Quebec. The TIQ was developed using expectancy-value theory. It consists of 33 belief items grouped under three broad motivational categories: perceived expectancy of success, perceived value of technology use, and perceived cost of technology use. In addition, teacher demographics, teachers’ current uses of technology, and availability of resources were also surveyed.
We also added two open-ended items that allowed teachers to provide anonymous comments on technology use. These open-ended items were added: 1) Suppose your school administration made additional resources available annually (example: release time for improving computer-based instruction). In your opinion, what kinds of resources should they provide? How would you like to see these resources used in order to improve your instructional use of computers? 2) Please describe the ideal use, if any, of computer technology in the classroom.
TIC. To gain insight into student technology use, we asked students to complete an online survey on the use of technology (TIC). The TIC was to have been administered in class four times to measure students’ technology use from March to May 2006.
Student and Teacher Sample
Students. The study was conducted in an English school board in Quebec that has had a one-to-one laptop initiative since 2002, when the program was piloted. Table 1 shows that, of the available sample of 458 Grade 3 students, 70.5% (N = 332) signed consent forms and produced data from both administrations of the standardized achievement measure. This sample was almost equally balanced between boys and girls.
Table 1: Overall Participation Rates.
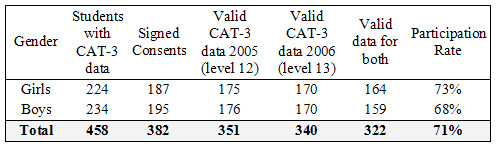
Teachers. Of 35 TIQs distributed to teachers in this study, 32 were completed and returned to the research team. Valid student CAT-3 data was received from 30 different classes. Of these, 28 had matching TIQ forms. The two missing TIQ forms were for teachers of classes with students from more than one grade level. In each case, there was only one Grade 3 student in the class (each of whom had valid CAT-3 data and consent forms). In terms of classes, 27 of 30 classes with valid student CAT-3 data had matched TIQ data; in terms of students, 322 students with valid data had matched TIQ data. Of the 27 matched TIQ forms, the incidence of missing data was negligible (< 0.50%).
Data Collection
Pretest data were collected from Cycle One (Grade 2) students from elementary schools in the second year of project implementation (2004-2005). In year three, posttest data were collected from these same students, now in Cycle Two (Grade 3). The board provided trained personnel to administer the tests.
- Grade 2: The pretest measure, administered in May 2005, was the CAT-3, level 12 (Basic Battery for Reading, Language, and Mathematics).
- Grade 3: The posttest measure, administered in May 2006, was the CAT-3, level 13 (Basic Battery for Reading, Language, and Mathematics).
Once the CAT-3 tests were administered, they were sent to the Canadian Testing Centre (CTC) for scoring. CTC forwarded results directly to our research team for analysis.
Along with the CAT-3 exams, consent forms were collected from Grades 2 and 3 students to comply with Canada’s Tri-council Policy on the ethical treatment of research participants. Parents were asked to consent for their child’s participation in the study, since all students were under the age of 18. All student participants were told that they had the right to discontinue participation at any time and to decide not to complete questionnaires if they did not feel comfortable in doing so. Principals and school board officials, in some cases, included a covering letter to parents, further explaining the rationale for and the scope of the research.
In the current investigation, we were especially concerned about the quality and quantity of teacher uses of technology, so we focused on these TIQ items in our analyses. A slightly modified version was distributed to teachers in spring of 2005 and 2006. The cover page of the TIQ indicated to teachers that by completing the questionnaire they were in fact consenting to participate in the study.
Design and Analysis
Students. The study was designed as a pretest-posttest study, largely because of the absence of a control school board that had no laptop initiative. Student data, however, were compared at the two points in time, 2005 and 2006, to the means of the national norms. So, students were treated as the unit of analysis for the first two research questions.
The norms of the CAT-3 were developed in 2000 based on a sample of 44,000 students (CAT-3 Technical Manual, 2002) from across Canada (including 1,629 students from Anglophone schools in Quebec). The subscales are considered to be valid and reliable measures of achievement against which comparisons of particular individuals, schools, and school boards can be made. Thus, the design of this portion of the study looked like this:

A one-sample t-test was used to compare the Grade 2 data for each measure against the norms and to compare the Grade 3 data for each measure. Since there were actual data only for the experimental group, this could not be treated as a 2 X 2 mixed design (with two repeated measures), as would have been the case if actual control group data had been available.
We hoped to analyze the TIC data to get an idea of how students perceived technology use in their classrooms. There was insufficient data to conduct meaningful and interpretable analyses as noted below.
Teachers and students. The TIQ data were treated differently since there were 27 teachers. Here, teachers were treated as the unit of analysis, and the mean of the three CAT-3 subtests was calculated. This provided three CAT-3 data points for each teacher. Correlational analysis was then used to examine the relationships between the CAT-3 subtests for reading, language, and mathematics and categories of technology use as generated from the TIQ instrument.
Results
Test-Retest Reliabilities for CAT-3 (2005 and 2006)
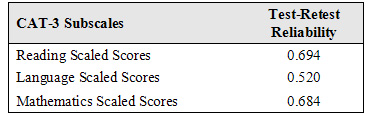
Test-retest reliability is the degree to which an assessment yields similar results from one testing occasion to another in the absence of intervening growth or instruction. Standardized instruments usually display the best test-retest reliability (compared to, for instance, teacher-made tests) because they are refined over repeated administrations so that items measure the same thing repeatedly. A good test-retest reliability for a standardized instrument is r = 0.80 and above. Since the CAT-3 tests in reading, for instance, given at different grade levels contain similar, but not identical items, the tests might be considered parallel forms. As a result the test-retest reliabilities might be expected to be somewhat lower than the desired standard. In addition, the one-year difference between administrations might have contributed to lower reliabilities. Table 2 shows the reliabilities of the three CAT-3 subtests, Reading, Language, and Mathematics, administered in 2005 (Grade 2) and 2006 (Grade 3). The reading and mathematics scaled scores demonstrate acceptable reliability, but the language subtest is somewhat low.
Table 2. Test-Retest Reliability (2005 and 2006; N =322)
Analyses by Research Question
1. What changes occurred in reading, language and mathematics between Grade 2 and Grade 3, relative to the published norms of the CAT-3 standardized instrument?
Reading Scaled Scores (2005 and 2006) Compared with National Norms.
Since it is likely that that there was no systematic application of technology and especially laptops in students who served in the norming sample, this is a reasonable approach. Table 3 shows the Reading statistics for 2005 and 2006. Figure 1 suggests a slight divergence for reading scores from Grade 2 to Grade 3.
Table 3. Descriptive Statistics for Reading Scaled Scores for 2005 (Grade 2) and 2006 (Grade 3).
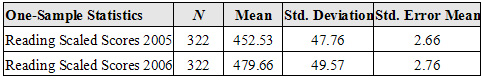
Table 4 indicates that the mean of reading scores is not different from the norm in 2005 (Grade 2) but that it is significant in 2006 (Grade 3). This represents a net loss over the year of the project.
Table 4. Test of Significance of RSS School Data (2005 and 2006) with National Norms.
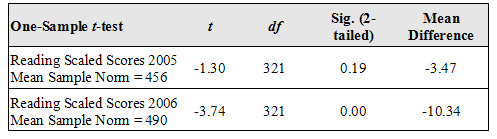
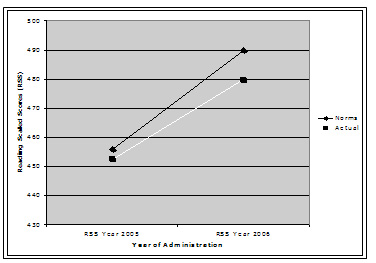 Figure 1. Reading Scaled Score Means and National Norm Means (Grade 2 and Grade 3).
Language Scaled Scores (2005 and 2006) Compared with National Norms.
Table 5 shows the Language Scaled Scores for Grades 2 and 3. Figure 2 suggests a change, or convergence, of Language scores compared to the National Norms from Grade 2 to Grade 3.
Table 5. Statistics for Language Scaled Scores for 2005 (Grade 2) and 2006 (Grade 3).
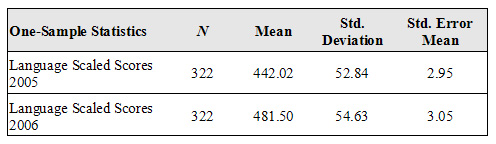
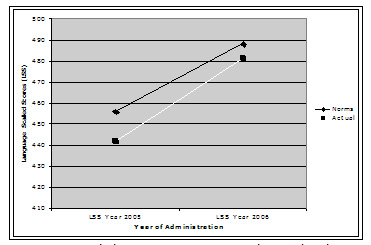
Figure 2. Language Scaled Score Means Compared to National Norms Means (Grade 2 and Grade 3)
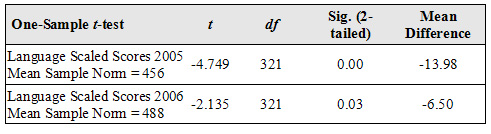
Table 6 indicates a slight change against the norm in language scores in 2005, but language scores are still significantly lower than the norm in 2006.
Table 6.Test of significance of LSS School Data (2005 and 2006) with National Norms
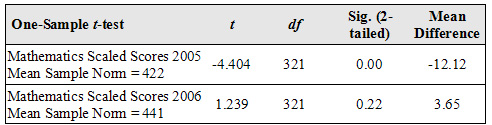
Mathematics Scaled Scores (2005 and 2006) Compared with National Norms.
Table 7 shows the Language Scaled Scores for Grades 2 and 3.
Figure 3 shows a crossover from Grade 2 to Grade 3, with Mathematics scaled scores lower than the National Norms in Grade 2 but higher by Grade 3.
Table 7 . Statistics for Mathematics Scaled Scores for 2005 (Grade 2) and 2006 (Grade 3).
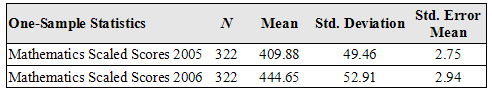
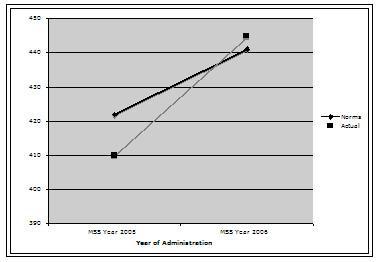
Figure 3. Mathematics Scaled Score Means Compared to National Norms Means (Grade 2 and Grade 3)
Table 8 indicates a moderate change against the norm in mathematics scores in 2005, crossing over the norm in 2006. Mathematics scores are significantly lower than the norm in Grade 2, but not significantly different than the norm in Grade 3.
Table 8. Test of Significance of MSS School Data (2005 and 2006) with National Norms.
2. What changes occurred between levels of achievement (Low, Medium and High) on the CAT-3 in Reading, Language and Mathematics on change scores between Grade 2 and Grade 3?
Some studies (CRF & Assoc., 2003; Mitchell Institute, 2004; Stevenson, 1999) have reported differential gain for lower achieving students, when laptops are integrated into the curriculum. In this study, the one-group pretest-posttest design makes it difficult to attribute gain between Grade 2 and Grade 3 to the introduction of laptops. In spite of this, it was deemed reasonable to examine change among different learner groups to determine if there is any suggestion of this prior finding. However, it must be acknowledged that in designs without control conditions, regression towards the mean in extreme groups (Campbell & Stanley, 1963) is a clearly understood threat to the internal validity of a pretest-posttest design, representing a perfectly plausible alternative explanation to any differences that might arise.
Change scores were calculated by subtracting Grade 2 scaled scores in Reading, Language and Mathematics from their equivalent scores in Grade 3. A variable with three levels, Low, Medium, and High, was created from the norms for each content area, so that empirical scores could be classified into groups. These served as the classification variable in one-way Analysis of Variance (ANOVA). Change scores served as the dependent variable. The question being answered was “Do the three levels of achievement based on the Grade 2 norms differ on the change in CAT-3 results from 2002 to 2003?”
An additional analysis was conducted to attempt to clarify the ANOVA results. Each mean change score within levels of achievement was compared (i.e., one-sample t-test) to the mean difference between the Grade 2 and Grade 3 derived from norming data. The intention was to determine if the change within levels of achievement differed from what would be expected based on the norms. The results of this analysis are indicated in the notes beneath the tables that follow.
ANOVA revealed a significant omnibus effect in all three content areas: Reading, F (2, 219) = 15,36, p = 0.00; Language, F (2, 219) = 37.71, p = 0.00; and Mathematics, F (2, 219) = 11.91, p = 0.00). Further exploration using Tukey’s post hoc procedures produced consistent results in regard to the relationship between Low and High achieving students (i.e., Low achievers always gained more). The results for the three post hoc analyses are shown in Tables 9, 10, and 11. Means in different subsets are significantly different. Means in the same subset are not significantly different.
On all three subtests, the gain was greater for Low achieving students than for High achieving students. In the case of Language and Mathematics, however, the change was equal for Low and Medium achieving students compared to the change of High achieving students. These results are consistent both with the literature previously cited of greater gains for low achieving students and the effects of regression to the mean in extreme groups.
Table 9. Post hoc analysis of three levels of students on CAT-3 Reading change scores (Grade 3 minus Grade 2).
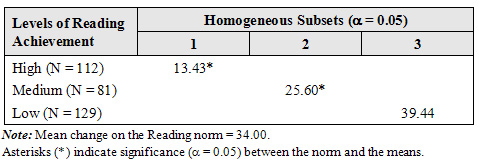
Table 10.Post Hoc Analysis of Three Levels of Students on CAT-3 Language Change Scores (Grade 3 Minus Grade 2).
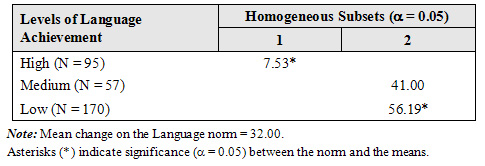
Table 11. Post Hoc Analysis of Three Levels of Students on CAT-3 Mathematics Change Scores (Grade 3 Minus Grade 2).
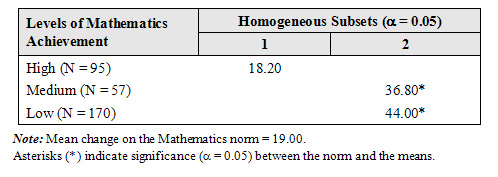
When mean change scores were compared to the average change in norms from Grade 2 to Grade 3 (i.e., one-group t-test), the Low group performed significantly better than the norm in Language and Mathematics. The High group performed significantly worse than the norm in Reading and Language. Combined with the results of ANOVA, this additional analysis suggests that the change is greater in the Low groups in Language and Math, compared with the High group. While these additional analyses do not substitute for results derived from comparisons with a no laptop control condition, it is suggestive of the differential effect noted in the literature. Whether this is due to the influence of the laptop initiative is still an open question.
3. How do students’ change scores in the three content areas relate to the levels and types of technology implementation reported by teachers (i.e., what laptops were used to accomplish and to what extent)?
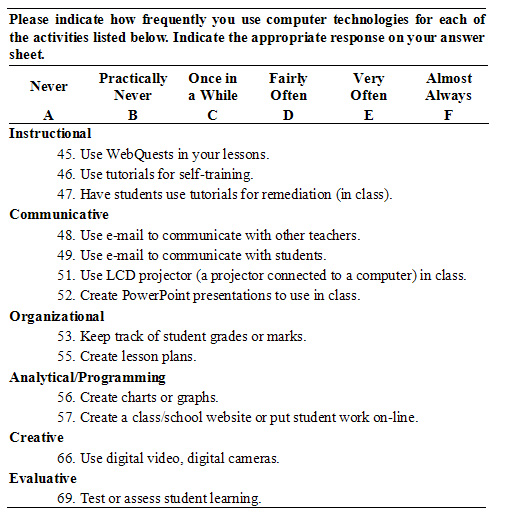
Data from 27 teachers were collected via the TIQ instrument that asks teachers to rate the extent of their use of technology in a number of categories. The categories and the individual questions were as follows:
The first problem that we encountered in this portion of the analysis that involves the TIQ is the fact that there are 27 teachers, each with one TIQ, and that there are 322 students each with CAT-3 scores in reading, language and mathematics. We solved this problem by using classes (i.e., teachers) as the unit of analysis rather than students. The problem with this approach is that it reduces the sensitivity or power of the analyses.
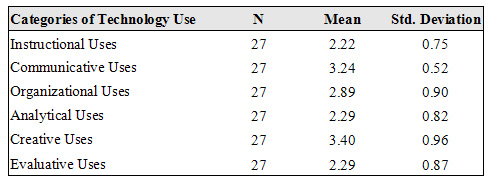
Initially, we analyzed items on the TIQ within categories of use. Item responses were added across categories and then divided by the number of items to produce category means. Category means (out of 6) are shown in Table 12. All of the means are below the theoretical centre of the scale of 3.5. According to the scale, most indicate use between “practically never” and “once in a while.” Notice that the two highest category means are Communicative Uses and Creative Uses, while the three lowest categories are Instructional Uses and Analytical and Evaluative Uses (equal means).
Table 12. Descriptive Statistics for TIQ Categories of Technology Use
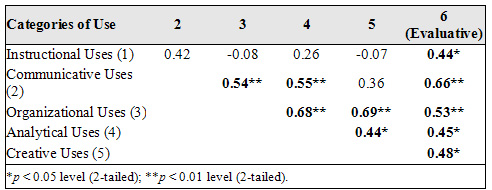
When we correlated these categories to find out how they related to each other, we found that some categories of use were positively correlated (See Table 13). A notable exception to this is Instructional Uses, which was significantly correlated only with Evaluative Uses.
Table 13. Correlations Between Categories of Use on the TIQ (N = 27).
The next analysis involved correlating the Categories of Technology Use with change (2006 minus 2005) on the three subtests of the CAT-3 (Table 14). While all of the correlations were negative, only three were significant, and all were on the Reading Subtest. On this subtest, Communicative, Creative, and Evaluative Uses were significantly negatively related to change.
Table 14. Correlations of Change on the CAT-3 Subtest scores (2006 minus 2005) with Categories of Technology Use (N = 27).
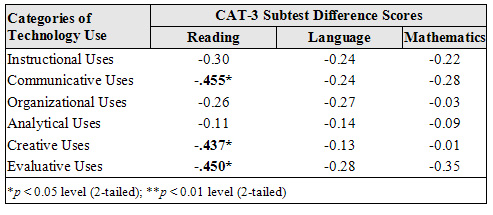
Figure 4 shows the negative relationship (Table 14) that emerged between CAT-3 reading change and three categories of technology use.
In Table 15, the relationship between specific TIQ items of technology use and CAT-3 Reading Subscale change scores is further explored. While the category of Instructional Uses was not significantly related to CAT-3 Reading change scores, the item Use of WebQuests was significantly and negatively correlated with CAT-3 Reading achievement change.
Table 15.Correlations Between Specific Technology Use Items and CAT-3 Reading Subscale Change Scores (N = 27).
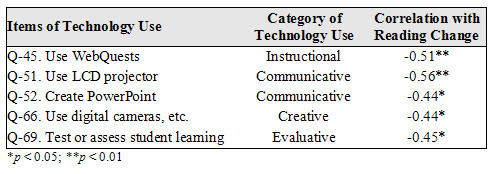
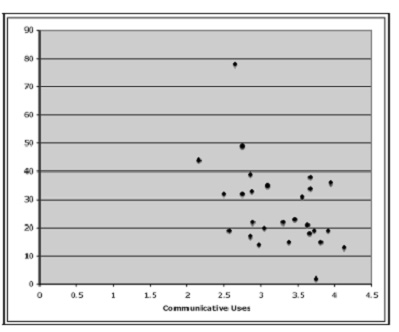
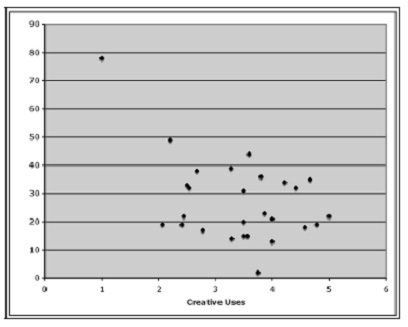
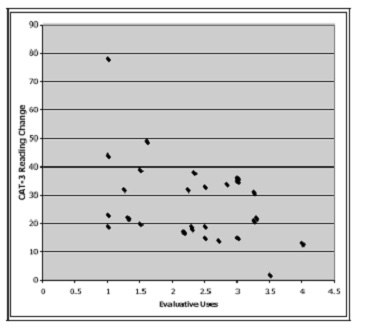
Figure 4. Scatter Plots of CAT-3 Reading Change and Categories of Technology Use.
TIQ Open-Ended Responses
At the end of the TIQ, two questions called for “open-ended” responses. These questions were:
- Suppose your school administration annually made additional resources available (example: release time for improving computer-based instruction). In your opinion, what kinds of resources should they provide? How would you like to see these resources used in order to improve your instructional use of computers?
- Please describe the ideal use, if any, of computer technology in the classroom.
The response rate to the TIQ open-ended questions was high. Of the 32 responding teachers, 30 gave answers to one or both of the questions. In addition six teachers submitted additional comments. Both teachers who answered neither question submitted additional comments also. All free responses were coded using an emergent approach, each question separately. From these initial codes, major themes were identified.
We identified several major themes. Chief among these was the need for increased professional development opportunities. In question A, 21 of 32 teachers (65%) mentioned the need for more training or workshops on both the hardware and software, particularly how both could be put to pedagogically sound uses. In addition, seven teachers (22%) agreed that release time would be an appropriate use of Board resources. One teacher asked for: “[h]ands-on workshops with a focus on pedagogically sound, age appropriate techniques, activities and approaches. (So far, our in-service has focused on writing responses to literature instead of more dynamic uses.)”
In question B, 17 (53%) teachers describe the computers as useful motivational or learning tools. At the same time, fourteen teachers describe more specific ways that computers could be integrated, including as facilitators of independent, dynamic learning; work sharing; student research; and inquiry-based, project-based, and problem-based learning. At the same time, three teachers were concerned that the implementation should complement rather than replace existing pedagogies. A further five teachers were concerned that technology integration should not be implemented at the cost of instruction on basic literacy and numeracy skills.
Of the seven teachers who wrote additional comments, four used the comments to explain their answers to question B further, giving examples of how they have successfully implemented one-to-one technology. One teacher commented:
I had not expected to use a computer often with learning disabled children, but I am now a complete convert. I can find activities to suit all levels (elementary-aged), and to address all sorts of needs. In addition, even the most challenged child is able to understand how to use the computer (sometimes better than me!)
The other three teachers submitting free comments were less enthusiastic about the program, bemoaning the planning behind and the time and money spent on a program they feel does not address important issues.
Discussion
Findings and Conclusions
The purpose of this project was to explore reading, language and mathematics achievement gains in the first year of implementation in this grade level of a ubiquitous laptop initiative in a Quebec school board. Further, we were interested in examining any possible effects in relation to Grade 2 levels of achievement to determine if there is any evidence of a differential effect for low achieving students. Finally, the results of the Technology Integration Questionnaire (TIQ), administered to 27 teachers who taught Grade 3 students, were related to change scores in reading, language and mathematics. The TIQ questions we examined related to teachers’ type and extent of technology integration over the school year. Responses to two open-ended questions at the end of the TIQ were synthesized and examined. The CAT-3 (Canadian Achievement Test) was used to measure Grade 2 and Grade 3 achievement in reading, language and mathematics.
There is little direct evidence in this study that the implementation of ubiquitous use of laptops in Grade 3 had any overall influence on achievement gains in reading, language and mathematics. The most dramatic gains against the Canadian norms between Grade 2 and Grade 3 occurred in mathematics, a content area that was not targeted by the project. Language scores improved marginally, compared with the norms, and performance in reading lagged behind the norms in Grade 3.
There is a suggestion in the data that the laptop initiative helped lower achieving students, particularly in language and mathematics. However, because of limitations in the design, no stronger statement than this can be made. This is because the findings of gain in the low achieving group and drop in high achieving students is consistent with what one would expect in an extreme group analysis. Low achieving students tend to score higher upon posttesting and high achieving students tend to score lower. The one potentially suggestive finding lies in the performance of the middle group, who can go either up or down. Especially in language and mathematics, the middle group increased against the norm in a manner similar to that of the low group. Again, this is scant evidence because of the threats to internal validity that are attendant to a one-group pretest-posttest design. Future studies involving a true control condition will have to be performed to unravel these relationships.
We were particularly interested in associating teachers’ reports of technology use to gains in reading, language, and mathematics. Correlational analysis was performed between responses to the questions on the TIQ that relate to categories and magnitude of use and students’ achievement scores. In spite of the limitations of statistical power involved in using teachers (N = 27) as the unit of analysis, we found significant negative correlations between reading change scores and teachers’ use of technology in the categories of instructional, communicative, creative, and evaluative uses of technology. Coupled with the reported generally low levels of technology integration by teachers (i.e., on average not even at the midpoint of the 6-point scale), what might be termed as “traditional uses,” might explain the somewhat disappointing results in reading. We stress, however, that these results cannot be interpreted as a causal relationship between teacher use and student outcomes. Correlational analyses, in the absence of a strong experimental design, can never be discussed in these terms.
In terms of contribution to the literature, the question of whether laptop programs can influence achievement in traditional content areas remains open. Our study did not establish any direct correspondence in this domain. The only really positive conclusion that can be strongly asserted is that the laptop program “did no harm” in the first year of its implementation with this Grade 2-3 cohort. It remains to be seen what effects might be achieved in subsequent years.
Design Concerns
Internal validity.
Threats to the internal validity of a study relate to aspects of its design that limit causal interpretations and pose alternative explanations for the findings. They may or not be present in this study, but without proper control for them, it remains unknown whether they are operating or not. The core research design was a form of the non-equivalent pretest-posttest control group design with the national CAT-3 normative scores serving as the control group (but with different participants in the pretest and posttest).
The most likely threats to internal validity involve interaction effects with selection. For example, selection by maturation effects may operate here as a rival explanation of a technology treatment effect. That is, the growth of one group might be different than that of the other group because the participants in each group were not identical to begin with. As previously mentioned, regression effects make interpretation difficult in an extreme-group pretest-posttest design.
External validity.
Threats to external validity are conditions of the sample, materials, or activities that limit the generalization of the results to the larger population.
In regard to population limitations, because only Grade 3 students in one school board were included in the study, the results reported here may not extend to other grade levels or students attending school in other areas of the province or country.
Since this was the first year of technology exposure for these students, aspects of the type and/or amount of exposure limit generalizations to either non-exposed students or those who have received more exposure.
The CAT-3 is a standardized instrument that is intended to measure reading, language, and mathematics skills and knowledge within different grade levels so that students and classes of students can be compared at that grade level. As such, it may not be as sensitive to achievement gains as true pretest to posttest measurement might reveal. In the absence of true pretest-posttest reliability estimates, we used the correlation between Grade 2 and Grade 3 scores in its place. The correlations we found were not as high as would be expected from a standardized measure.
Likewise, the TIQ was designed to assess teacher attitudes about the expectancy, value and cost of the use of technology integration in education and, therefore, may not adequately address the range of issues related to the frequency of use of technology.
Because of funding limits, we were not able to conduct as comprehensive a measurement as we did at the outset of the longitudinal study. We did not collect data on student self-regulation or self-concept, interview teachers, or observe them and their students using technology in the classroom.
All studies are limited in the extent to which they generalize across populations, settings, treatment variables, and measurement variables. This study is certainly no exception. The findings, then, should be interpreted with these cautions in mind. While a more complete analysis probably would not reverse the current findings, a more complete analysis would serve to deepen our understanding of the findings and identify those conditions to which the results applied or did not apply.
Overall limitations.
In the absence of a no-technology control condition (except for the CAT-3 national norms), we cannot conclude that technology was harmful to achievement, even in reading. These are correlational analyses that warrant the same considerations and cautions with respect to causation, that are attendant in all such designs and analyses. Therefore, the actual effect of technology use particularly on the development of reading skills and comprehension remains speculative at best. More importantly, the data do provide some suggestions as to the type of technology use that may warrant further investigation.
Furthermore, the results are most appropriately restricted to early elementary students and their teachers in the initial phases of using technology for learning. It is inappropriate to conclude these findings would hold for older students and their teachers or when students are more familiar with technology as a tool for learning.
Major educational innovations are not easily achieved and may reveal disappointing results at the outset. Time, effort, and experience may be the basis on which solid developments are built. Sweeping changes may take time even while novelty and enthusiasm may make temporary change apparent. With time, does the novelty wear thin or does experience lead to better teaching and improved learning?
Computer technologies have long been known to increase administrative efficiencies and, in more recent years, have come to be a very reliable and useful means for people to communicate with each other. Where we still struggle, is in the use of technology for effective teaching and learning. As described above, the literature is still mixed as to whether it helps children learn in the areas of reading, language and mathematics, or whether it is neutral, or whether it actually impedes learning in these areas. What does seem clear is that we cannot expect to see a generalized “technology effect” on student achievement simply by adding technology to a classroom. Not only must there be a plan for the physical and practical integration of technology, but also a plan for pedagogical integration that takes advantage of the unique affordances of the technology.
It is conceivable that technology applications that increase active engagement with reading, writing, and mathematics may eventually provide efficiencies in instruction that are equivalent to the efficiencies in administration that are so well documented. Herein lies the challenge for every teacher who is intent on making technology work as a means of furthering the goals of schooling and learning in general.
References
Campbell, D. T. & Stanley, J. C. (1963). Experimental and quasi-experimental designs. Chicago, IL: Rand McNally.
Canadian Test Centre. (2002). Canadian Achievement Tests Third Edition (CAT-3): Technical manual. Markham, ON: Canadian Test Centre.
CRF & Associates. (2003). The impact of Plato Learning, Inc. Technology in East Rock Magnet School. New Haven, CT: East Rock Magnet School. Retrieved March 24, 2007, from http://www.eastrock.org/downloadfiles/ east_rock_impact_study.pdf
Cuban, L. 1986. Teachers and machines: The classroom use of technology since 1920. New York: Teachers College Press.
Gulek, J., & Demirtas, H. (2005). Learning with technology: The impact of laptop use on student achievement. Journal of Technology, Learning, and Assessment, 3(2). Retrieved January 25, 2007, from http://webdev.shorelineschools.org/instruction/tech/pdf/jtla(1-1impact).pdf
Lowther, D., Ross, S., & Morrison, G. (2003). When each one has one: The influences on teaching strategies and student achievement of using laptops in the classroom. Educational Technology Research and Development, 51(3), 23-44.
Mitchell Institute. (2004). One-to-one laptops in a high school environment: Piscataquis Community High School study final report. Portland, ME: Mitchell Institute. Retrieved March 24, 2007 from http://www.mitchellinstitute.org/Gates/pdf/One-to-One_ Laptops_ Report .pdf
Newhouse, P., & Rennie, L. (2001). A longitudinal study of the use of student-owned portable computers in a secondary school. Computers & Education, 36(3), 223-243.
Oppenheimer, T. (2003). The flickering mind: The false promise of technology in the classroom and how learning can be saved. New York: Random House.
Penuel, W. (2006). Implementation and effects of one-to-one computing initiatives: A research synthesis. Journal of Research on Technology in Education,38(3), 329.
Russell, M., Bebell, D., & Higgins, J. (2004). Laptop learning: A comparison of teaching and learning in upper elementary classrooms equipped with shared carts of laptops and permanent 1:1 laptops. Journal of Educational Computing Research, 30(4), 313-330.
Russell, M., Bebell, D., O'Dwyer, L., & O'Connor, K. (2003). Examining teacher technology use: Implications for preservice and inservice teacher preparation. Journal of Teacher Education, 54(4), 297.
Sclater, J., Sicoly, F., Abrami, P., & Wade, C. (2006). Ubiquitous technology integration in Canadian public schools: Year one study. Canadian Journal of Learning and Technology, 32(1). Retrieved December 13, 2006, from http://www.cjlt.ca/content/vol32.1/sclater.html
Stevenson, K. (1998). Evaluation report - year 2: Schoolbook Laptop Project, academic year 1997/98. Beaufort, SC: Beaufort County School District. Retrieved March 11, 2007, from http://www.beaufort.k12.sc.us/district/ ltopeval.html
Stevenson, K. (1999). Evaluation report - year 3: Middle School Laptop Program, academic year 1998/99. Beaufort, SC: Beaufort County School District. Retrieved March 11, 2007, from http://www.beaufort.k12.sc.us/ district/evalreport3.htm
Stevenson, K. (2004). Liverpool Central School District: Evaluation report - year 3 High School Laptop Computer Program for school year 2002/2003. Syracuse, NY: Liverpool Central School District. http://www.liverpool.k12.ny.us/Laptops/3rdyearevl.pdf
Trimmel, M., & Bachmann, J. (2004). Cognitive, social, motivational and health aspects of students in laptop classrooms. Journal of Computer Assisted Learning, 20(2), 151-158.
Wozney, L., Venkatesh, V., & Abrami, P. C. (2006). Implementing computer technologies: Teachers’ perceptions and practices. Journal of Technology and Teacher Education, 14(1), 173–207.
© Canadian Journal of Learning and Technology
ISSN: 1499-6685