Authors
Luca Botturi, is an Instructional Designer with eLab, Università della Svizzera italiana, Lugano, Switzerland. Correspondance regarding this article
can be sent to luca.botturi@lu.unisi.ch
Abstract: This paper reports the results of an empirical study that investigated the instructional design process of three teams involved in the development of an e-learning unit. The teams declared they were using the same fast-prototyping design and development model, and were composed of the same roles (although with a different number of SMEs). Results indicate that the design and development model actually informs the activities of the group, but that it is interpreted and adapted by the team for the specific project. Thus, the actual practice model of each team can be regarded as an emergent feature. This analysis delivers insights concerning issues about team communication, shared understanding, individual perspectives and the implementation of prescriptive instructional design models.
Résumé: L’article présente les résultats d’une étude concrète qui a mis l’accent sur le processus de conception de l’enseignement de trois équipes participant à la création d’une unité d’apprentissage en ligne. Les équipes ont déclaré qu’elles utilisaient la même conception de prototypage rapide et le même modèle de développement et qu’elles avaient les mêmes rôles (bien qu’un nombre différent d’experts en la matière). Les résultats indiquent que la conception et le modèle de développement représentent bien les activités du groupe, mais qu’ils sont interprétés et adaptés par l’équipe aux fins du projet en question. Ainsi, le modèle pratique de chaque équipe peut être considéré comme article émergent. Cette analyse rend compte d’opinions touchant des questions comme la communication au sein de l’équipe, la compréhension partagée, les perspectives individuelles et la mise en œuvre de modèles normatifs de conception de l’enseignement.
Research in Instructional Design (ID) has produced a number of models that strive to blend prescriptive value and proximity to the practice of instructional designers. ID models are rooted in different cultural and epistemological perspectives. Classic ID models, for example ADDIE (Leshin, Pollock & Reigeluth, 1992; cf. also the idea of ADDIE models, Visscher-Voerman, 1999) stem from a behaviouristic view of teaching and learning (cf. Dick, Carey & Carey, 2001). More recent ID models, such as the one proposed by Morrison, Ross and Kemp (2003), offer a more heuristic approach in order to make it more responsive to the practice. Still other scholars have proposed constructivist instructional design models (e.g., Willis, 2000).
What actually happens in the practice of instructional designers? What do they do, and how do they structure their activity? A recent literature review by Kenny, Zhang, Schwier and Campbell (2005) indicates that astonishingly, in a field that produced a plethora of more than a hundred theoretical models (Andrews & Godson, 1995), only seven papers reported findings of empirical studies about the practice of instructional design, and only three case studies indicated the activities designers actually performed. By that review, it seems that despite being widely used in the education of future instructional designers, ID models tend to only inspire the practice, without really informing it—the model gets adapted to each specific project and situation.
ID theory presents the instructional designer as a person who demonstrates design competencies on the job regardless of job title, training or job setting (Richey, Fields & Foxon, 2000). This assumption may lead to a distorted individualistic view of the ID practice, in which the instructional designer is the one who carries out the design and development process, at times collaborating (or interfering) with other people. Instead, the success of an ID project is often a team achievement. A large part of ID projects, especially those in e-learning1, involve interdisciplinary teams (Bates, 1999; Bates & Poole, 2003). This has two important methodological consequences. On the one hand, team communication and management represent a large part of the instructional design activity (Cox & Osguthorpe, 2003; Liu, Gibby, Quiros & Demps, 2002). Thus, these competencies should be included in the instructional designer’s skill portfolio and be researched as such. The literature suggests “that the development of effective blended instruction is a complex process requiring extensive interactions among a team of instructional product designers and developers” (Liu et al., as cited in Kenny et al., 2005). On the other hand, the real actor in a project is the team and not solely the instructional designer. For the purposes of this study, a relevant question is “How does the team behave with respect to an ID model?” In other words, this study focuses on the development team, rather than the lone instructional designer.
The goal of this study is to contribute to the growing—but still limited—body of literature concerning the actual practice of instructional design (Dicks, 2005; Kenny et al., 2005). The specific perspective taken is to investigate communication practices among instructional design and development teams. Communication is in fact the basic element that creates a team from different professionals with different professional languages (Botturi, in press) and it appears to be a demanding activity for instructional designers (Liu et al., 2002). The assumption behind communication is that
[T]he instructional design practice is constituted by socially and culturally produced patterns of language, or discourse, with socially transformative power through the positioning of the self in explicit action (Francis, 1999). ... In other words, we view instructional design as a socially constructed practice rather than a technology to be employed. (Campbell, Schwier & Kenny, 2005, p. 244).
Recent studies have shown that ID models provide guidance to instructional designers, but do not actually portray the real practice of instructional design projects. For example, ID models serve as a compass, or as a cognitive tool, rather than a recipe book or a prescriptive procedure description (Kenny et al., 2005). Thus, a design team is inspired by a model, selects its guidelines and adapts it to a specific project situation. This finding is strongly confirmed by personal experience; I expect that shedding light on the communicative dynamics that take place within an instructional design and development team will also help to explain how selection and adaptation happens. The study delivers some insights about these issues, formulated as research hypotheses in the body of the paper that suggest a possible direction for future research.
The study selected three ID teams at work on three similar projects in a campus-based European university. The teams were implementing the same theoretical rapid prototyping model. Their inner communication practices were analyzed by means of empirical research tools in order to answer the following questions, which form backbone of the paper:
The next section of this paper describes the design context of the three teams that took part in the study. The third part of the paper introduces the design model the teams adopted. The fourth section describes the research method, which is followed by the presentation of the main results. The discussion of results is organized into four short sections which are presented prior to the general discussion and conclusions.
This study investigated three e-learning design and development teams from the University of Lugano, Switzerland. These teams were part of three large e-learning projects funded through the Swiss Virtual Campus program (SVC; cf. SVC, n.d.), a federal program that supports the introduction of communication and information technologies in Swiss higher education institutions. SVC projects involve a network of at least three institutions (universities, universities of applied sciences and/or technical universities) with the goal of producing high-quality, online courseware on a specific topic. The final product should be flexible enough to allow the integration in different programs at each partner institution. Usually—and it was the case for the three teams involved in the study—SVC projects opt for a modular structure, i.e., the final product is composed by different independent units, usually called modules. The units can be thought of as large-scale learning objects (Wiley, 2000), covering 5–10 hours of instruction, although Learning Technology Metadata standards such as SCORM are seldom used.
In the three SVC projects analyzed in this study, the University of Lugano served as the project’s leading house, and the teams were in charge of developing the first learning unit in the project. All of the teams started the projects between July and September 2004, and delivered their first finalized product at the time of this study, i.e., May–June 2005. A brief description of each project follows.
Ecology in Architectural Design is the subject area Project 1 is concerned with, and its aim is to produce courseware about energy, water, pollution and population concerns in architecture. The materials it wants to deliver support project-based learning through expert interviews, exercises and case studies. The target students are students in Architecture and Construction Engineering. Project 1 involves a team of four: a construction engineer, serving both as Subject-Matter Expert (SME) and project leader, an instructional designer with background in communication, a graphic designer and a web programmer.
Project 2 involves students in Informatics, Communication and Hypermedia Design as a target group. This project is aimed at the development of a collection of online resources about the usability of web applications, including basic concepts and different evaluation methods. The idea is to provide tools for hands-on exercises of web site analysis with different methods. The five-member team includes a SME and team leader, another SME, an instructional designer who is also an expert in usability, a graphic designer (the same as Project 1) and a web programmer.
Media history and analysis is the topic of Project 3, which aims to develop online materials for students in Communication, Journalism and Media Studies. This project enjoys the support of the archives of the Swiss Radio and Television, and is focused on providing the students with a rich set of audiovisual historical and contemporary documents to work on. This six-member team includes two SMEs and co-leaders, one additional SME, an instructional designer, a graphic designer with an unusual background in Physics and a web programmer (the same as Project 2).
In general, all of the teams share some similar characteristics:
All team members are specifically trained for their tasks. Interview data confirms that all participants are committed to the projects and enjoy their work, and each has a positive attitude toward learning technologies. All of the team members, except the instructional designers, are new to an e-learning project, and only two of them have had experiences as e-learning students. Moreover, data from a separate observation of the teams (not included in this study) indicate that all teams were successful in delivering the product on time and on budget; subsequent user testing confirmed the courseware to effectively support learning in the target settings. The differences in communication and shared mental models presented in the present study should not therefore be interpreted as impacting on positive or negative outcomes; rather it should be taken to mean diverse “ways of life” for the different teams.
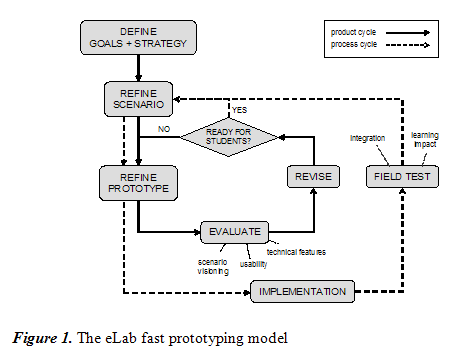
The most important shared trait discovered in this study is that all teams refer to the eLab fast-prototyping model (Botturi, Cantoni, Lepori & Tardini, in press). This model was developed in order to enhance team communication through fast prototyping in large e-learning projects in higher education, and in particular:
The model is structured in two cycles: (a) the inner or product cycle, and (b) the outer or process cycle (Figure 1).

The design and development process starts with the identification of high level learning goals and of a specific strategy, e.g., teaching level B1 English with a game-based strategy; or teaching the basics about colour perception with a case-based approach. The model recommends this is done as a team effort in order to create a common vision.
These elements are embedded in a scenario, a narrative and semi-formal description of the instruction, which sets some parameters, namely: target students, communication flow and support, the organization of the schedule as time and as blend of face-to-face and distance learning activities, the use of multimedia and interactive technologies. The scenario is an informal definition of the instructional and technical requirements for the project. The development of a shared scenario, guided by the instructional designer, is in itself an important activity for the project: its writing requires team members to discuss the main issues in the project in practice and to imagine the final product from the student’s eyes.
The scenario is the initiating point for the product cycle, which starts with prototype development and is aimed at developing a product that fits the scenario. By prototype it is meant a structured courseware, with real content, already implemented as if it were to be used in a real setting. The project team internally evaluates the prototype in two ways: (a) the technical staff evaluates it with standard procedures which assess its technical features and usability, and produces a list of improvements; (b) other non-technical team members proof the prototype’s fit to the scenario description, in a focus group in which they envision its use, still without involving real users. This twofold formative evaluation and revision process provides a full-spectrum feedback, and forces the project members to move one step further in the development of a shared understanding: while developing the scenario, they described a potential situation; now, the prototype compels them to evaluate single features (e.g., navigation structures, exercise feedback, etc.) and to make decisions. This discussion also helps the designers to develop insight into the non-technical partners’ understanding of the instruction.
After the evaluation, the prototype is consequently revised, and a decision is made if it is ready for real testing. If it is not, another product cycle is performed, starting from a refinement of the scenario according to the new possibilities explored during evaluation. If the prototype is deemed ready for user testing, the process moves on to the process cycle.
The process cycle is basically a field test with real users. Its first step is the refinement of the scenario (a virtual description) into the actual description of a single instance use setting. The prototype is accordingly revised and adapted, and it is then implemented and integrated in the course. The testing is constantly monitored, and the final evaluation of the process cycle happens in three steps:
The evaluation provides new inputs to the project team, who can then decide to make revisions and perform another test, to conclude the implementation and produce the final courseware, or even to switch back for another product cycle, in the event that the real situation has proved different from the scenario.
This study followed an empirical method based on a combination of Social Network Analysis (Scott, 1991) and concept mapping (Novak & Gowin, 1984; Novak, n.d.). Sociograms, which are simple constructs from Social Network Analysis, allow us to capture and describe social and team structures. Sociograms were used to provide a portrait of each team from the point-of-view of collaboration and communication.
The use of concepts maps, originally developed for teaching and collaborative learning, has already been extended to knowledge management and social science research as a tool for the elicitation and representation of expert knowledge (e.g., Coffey, Hoffman, Cañas & Ford, 2002; Coffey, Eskridge & Sanchez, 2004), the development of group conceptual framework (Trochim, Cook & Setze, 1994), and for group evaluation and program planning (Trochim, 1989). The design of this study employed concepts maps to capture team members’ perspectives and knowledge of the design and development process, and to further analyze the data with a structured approach described below.
The delimitation of teams did not follow official project descriptions, as they often included faculty members who signed documents without being actually involved in the design and development. For the purposes of this study, a team included all those who actually contributed to making decisions or to developing artefacts that influenced the final instructional product, i.e., the courseware delivered by the team.
Individual interviews were conducted with all of the team members involved in the three projects. For data elaboration, names were coded in order to ensure privacy. The interview protocol, which took about 1 hour, was composed of two parts: structured questions and the graphic interview. The protocol description is available in its English translation in the Appendix.
Questions included items that probed personal information and background, along with a description of the interviewee’s previous experiences with e-learning as student, teacher/instructor or member of a design team. Some questions addressed the project and the project team, asking the interviewee to state project goals and to describe her/his role in the project. Finally, the last questions addressed team communication.
As all interviewees gave their consent, this part of the interview was recorded and later transcribed. While the interview was being conducted, the interviewer also took notes, which were also digitally transcribed for elaboration.
During the graphic interview, participants were asked to represent the project and the project team in three ways: through an individual sociogram, through a process map, and through a concept map.
At the end of the interview, participants were asked to review their diagrams and to check that all important elements were included.
Individual sociograms were combined in order to create team sociograms. In this study a team sociogram is a simple social network represented as a directed and valued graph that has team members as nodes and relationships among them as arcs (Berkowitz, 1982; Scott, 1991). Each arc has a value that indicates the strength or degree of the relationships, as expressed during the interview on a 5-point scale. The example in Figure 2 indicates that Esteban declared that he communicates a lot with Anna (oriented arrow from Esteban to Anna, red indicating a high value); Beatrice indicated she does not communicate directly with Carl—in fact there is no arrow between them. The values of all incoming arcs in each node (or indegree) are then summed to produce the personal score of an individual team member, which represents the degree to which that person is important in the collaboration and communication activities of others. Individual scores were normalized in order to make sociograms from different teams comparable, and colour-coded. All personal weights in a single team sociogram give a sum of 100.

As already mentioned, for each team, two sociograms were produced: the first one representing the distribution of communication (talking to, messages); the second the collaboration (working together with, depend on) within the team. A sample of a communication sociogram, taken from Project 3, is reported in Figure 2.

Concept maps were digitized according to specific guidelines, in order to make them comparable without losing information. They were then used as Individually-Constructed Mental Models (ICMM) in the analysis process described below. An example of individual concept map is shown in Figure 3.
The Analysis-Constructed Shared Mental Model method (AC-SMM) was applied in order to create a concept map that represented the shared view of each team, or team SMM. This recently developed method provides a standard procedure for identifying shared team cognitive constructs related to a specific task (Johnson, O’Connor & Darabi, 2005; O’Connor & Johnson, 2004). AC-SMM was tested for reliability with positive results (O’Connor, Johnson, Khalil, Lee & Huang, 2004).
The method proceeds through the following steps:
The method was slightly rearranged: the inclusion threshold, which was set to “equal or above the half of the group members” (i.e., 2 out of 4, 3 out of 5, 3 out of 6, in the three cases) was applied only to concepts. Links and clusters among shared concepts were included even if they appeared only once, but had a stronger weight if they appeared more than once. This was done as very few ICMMs presented shared links. Moreover, no shared sequence was found.
All ICMMs were then put together into a unique sheet, and a global SMM was generated, as the shared mental model of all projects. In this case the threshold value was set to 8 (out of 15 ICMMs) with at least one count for each project team. The global SMM can be considered as the generic shared mental model of real implementations of the fast prototyping model, and will be discussed later on.
In order to allow a more formal comparison, a specific sharedness index was calculated for each team. This number varies between 0 and 1 and expresses the degree of similarity of single ICMM to the SMM, and was calculated as: 2

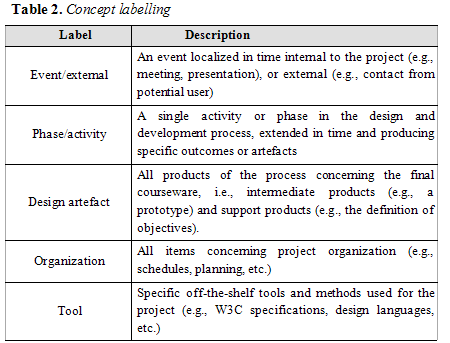
The SMM and the sharedness index were finally cross-read with process diagrams, interview data, and with sociograms. The concepts in ICMM were labelled according to five categories: events, phase/activity, design artefact, organizational, tool. The non-shared concepts were then analyzed and the information organized in “perspectives” according to the specific roles in the project.
The following sections present the main results of the study following the track set by the research questions. An effort is also made in order to identify differences and commonalities among the three projects.
The first research question concerns communication within the team. Who is in touch with whom? Given that the team as a whole collaborates, who actually works with whom in the day-to-day practice? As mentioned previously, the communication element is paramount for understanding the actual interaction among group members and the very structure of the team’s activity. For example, do SMEs directly work with graphic designers, or do they leave it to the instructional designers? Do instructional designers have a coordination or a technical role? An answer to this research question comes from sociograms, which represent the communication and collaboration network of each team. Each team member has a personal score, which indicates how other team members value her/him as crucial for their practice.
In general all sociograms have density=1, i.e., they have no isolated nodes/team members. Moreover, all projects have “external team members”, i.e., people who do not participate fully in the project (and often are also formally excluded), but that provide substantial help through communication, with advice, comments, and so on. Project leaders are the ones that usually keep contact with the extended external network.
At first glance, the communication scores in the three pairs of sociograms (see Table 1) reveal an almost trivial finding: team leaders and instructional designers play a stronger role in communication diagrams (higher communication scores), while web programmers and graphics designers acquire increased importance in collaboration on specific production matters. This is indeed not trivial as it indicates that the communication pattern of instructional designers differs from that of technical roles, i.e., web programmers and graphic designers. Instructional designers are involved in communication in a more extended fashion than other team members.
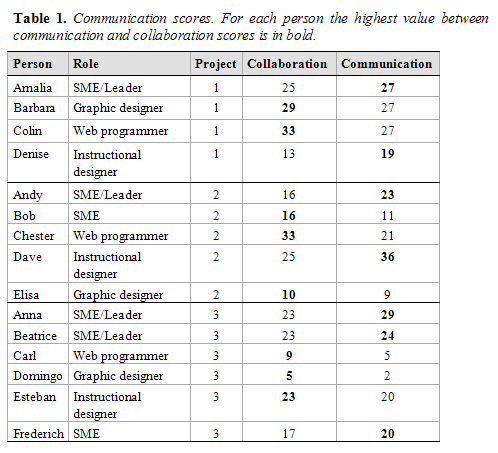
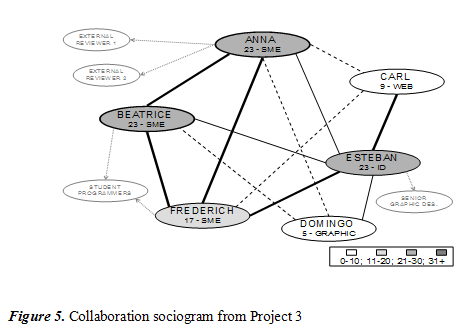
The general shape of the sociograms varies. Those from Projects 2 and 3 present clear differences in how members took part in communication. On the one hand, the sociograms reveal a strong network between the SME(s) and the instructional designer with high personal scores on communication and a little lower on collaboration. On the other hand, there is another network among more technical roles (the graphic designer, the web programmer and the instructional designer), with a generally lower score than the first network, higher in collaboration and lower in communication. The instructional designer appears to be the glue between the two sub-networks, in a mediator or translator position, with very high personal scores. If we assume, as the literature reported in the introduction suggests, that communication is a key element for the effectiveness of a design team, this special role of the instructional designer becomes critical.
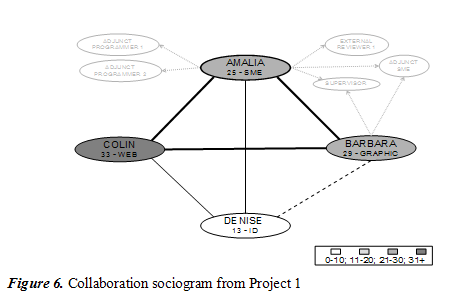
In order to illustrate this finding, a simplified version of collaboration sociograms of Projects 2 and 3 are reported in Figures 4 and 5. Collaboration relationships are indicated by arc thickness (dotted line indicating scarce collaboration, thick line indicating strong collaboration), and personal marks are reported in each team member’s node, also highlighted with a corresponding shade of grey. Each arc represents the sum of collaboration values between the team members represented by the nodes (e.g., from Andy to Dave and vice versa). Arcs are consequently not oriented.
Project 1 shows a striking difference (cf. the collaboration sociogram in Figure 6) from that of Project 3. The sociogram reveals a distributed pattern, in which there are basically no differences between the team members participation (scores) in communication and collaboration. One reason for this is that the team was reduced in size, counting only 3 members, and this facilitated a flat or democratic communicative structure. A second reason is that, in this case the instructional designer started the project, and was then away on a research period for six months; although she kept email contact with the team, she was back for the finalization of the project. She therefore could not play the coordination role that emerges in the two other projects.

These results enables me to put forth a research hypothesis, which I will call communication enhancer hypothesis:
The instructional designer plays a crucial mediator role in the team between technical and content/teaching oriented roles. If s/he is unable to carry out this function and cannot be replaced, this results in a flat or undifferentiated team communication pattern.
Depending on the situation and on the size of the team, adopting a flat communication pattern might lead to different consequences. The point here is that the instructional designer can play a key role in team communication – s/he should be aware of this and decide how to take on this responsibility.
If sociograms provide a static view of communication, process maps reveals that the intensity of communication varies over time. Communication peaks generally happen in shared phases (implementation and testing, see below) and before and after meetings. This confirms that the AC-SMM analysis actually identifies the phases and activities in which the team works together and has more intense exchanges. Interestingly, team members with different roles perceive slightly different peaks, or the same peak but with different intensities: for example, web programmers see it during the implementation phase, while SMEs observe this peak in testing.
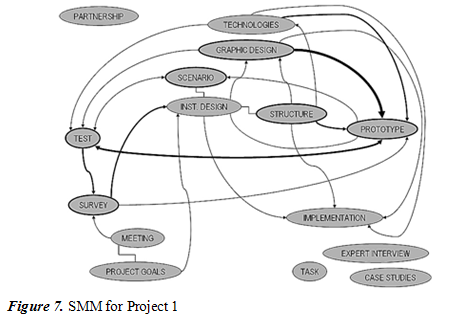
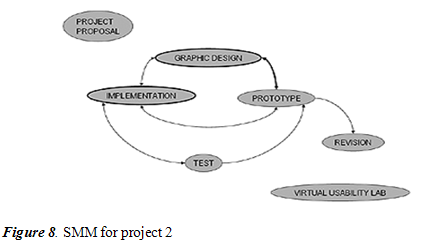
The second research question addresses the generation of a shared understanding or overall map of the project. Some insights about this come from the observation of the three team SMMs. Team SMMs represent the activities that the majority of the team deems important, and they can be interpreted as the social space or common ground on which team members can interact and collaborate. In Figures 7, 8 and 9, the thickness of arcs and concept borders is proportional to the degree of sharedness.
As observed above, Project 1 has a distributed or flat communication pattern, and this is reflected in the large number (17) of shared concepts in the SMM, and by its interconnectedness (Figure 7). Also, the high sharedness index (0.17) confirms that the teams share a lot of what they do and use to make decisions together.
With a striking difference from Project 1, the SMM of Project 2 looks minimalist, counting only 7 shared concepts (Figure 8). This data, read together with the correspondingly low sharedness index (0.08), indicates that this team is more oriented to a divide et impera method: few milestones in which the different contributions are put together. This interpretation also corresponds to the background of the team leader (Communication Technologies), who has shaped the team’s working process and indicated milestones as important elements in his ICMM.
The SMM of Project 3 (Figure 9) has 10 shared concepts and sharedness index of 0.10, indicating a situation midway between the other two projects. Interestingly, this SMM has no isolated concept, revealing an integrated view of the project.
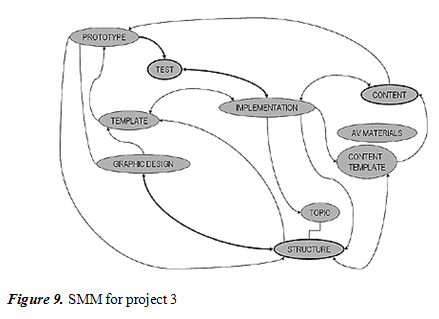
The first observation is that, despite the similarities in team characteristics and the adoption of the same theoretical design model, there is a strong diversity in SMMs. The SMMs reveal that all teams have shared phases, in which they work together. They are implementation, testing, revision, and design, and they are also included in the fast prototyping model. But most of all, the shared practice of teams is based on artefacts: some of them appear in all SMMs (graphic design, structure, prototype), while others represent peculiar features and constructs of each project. For example, Project 2 contains a Virtual Usability Lab (VUL) as one of its main achievements; Project 3 is based on archive A/V materials; Project 1 is task-based and exploits case studies and interviews.
These findings indicate that in each project collaboration is organized around specific artefacts, and that there are some phases (for all projects: implementation and testing) in which the group actually works together side by side. Other artefacts and activities are assigned to individual members, according to their specific competencies and involvement. The global SMM reported below will allow a deeper exploration of this point.
Interestingly, no ICMM portrays the whole fast prototyping model or a significant portion of the team SMM. This indicates that no single team member has a complete view of the whole process rather each actor in the process has her/his specific view. The overall process—and the design model as a theoretical construct—is therefore the result of the integration of subjective views, as an emergent feature: something more valuable than the mere sum of parts.
For example, the map of Project 2 includes elements clearly taken from the model, such as IMPLEMENTATION, TESTING and REVISIONS. Yet they are in a different structure (namely, not in a cycle), and are surrounded by project-specific elements, such as the VIRTUAL USABILITY LAB and the PROJECT PROPOSAL, and other general elements not included in the model, such as GRAPHIC DESIGN. It is also interesting to notice what is not in the map, for example, the scenario, or the goals and strategy (probably included in the PROJECT PROPOSAL), and the field test.
The sharedness index is generally low (Project 1 = 0.17; Project 2 = 0.08; Project 3 = 0.10), indicating that only a small part of the “project world” of each team member is actually shared. Also, there is a large variation among the projects. Project 1’s index is more than double the value for Project 2. This indicates that the members share a larger part of the activities, artefacts and events in the project. As mentioned previously, the history of each of the projects after this study confirms that the three teams involved in the study were all successful. Therefore, this finding indicates that there are different ways for a team to collaborate and to be effective: a more shared view is not necessarily better. It should be investigated further what forms communication takes in the different cases and what elements complement this dynamic.
In order to tackle the issue formulated in the third research question, the concepts in ICMMs and Team SMMs were labelled and colour-coded according to the types presented in Table 2. The types were defined by clustering the elements in all SMMs.

The ICMM presented before in Figure 3 is now shown with colour labels (rendered in shades of grey) in Figure 10.
A careful observation of labelled maps reveals that people covering specific roles in project teams have similar individual perspectives. Instructional designers seem to focus on the artefacts about courseware structure and on the scenario of use, and on the tools being used in single phases – a feature web programmers also share.
On the other hand, project leaders perceive external events (reviews, contacts, etc.) as essential in shaping the project – thus confirming their attention toward the external environment already noticed in comments on the extended network they represented in sociograms: “often we get requests from the outside, or we took part in events, and this pushes us to new developments” stated one project leader. This broad view of the project as an entity in a wider environment is confirmed by a comparison of process diagrams: project leaders see the project beginning long before the kick-off meeting, assuming an historical perspective which unfolds a narrative about the stimuli that led to the set up of the project, about the very idea that initiated the process, and so on.
The ICMMs of the two persons that took part in two projects (one web programmer and one graphic designer) provide an interesting insight, which can be formulated as a second research hypothesis, which I call the Extending view hypothesis. These persons’ views of the two projects they worked on are profoundly different. For example, the web programmer in Project 3 complained of not being able to provide a detailed description of the project, because he had “a single person as reference, and (…) only a marginal understanding of the project as a whole.” But the same person was able to provide a lot of detail concerning Project 2, in which he was also involved as a web programmer.
For the project in which they were more involved, these persons have a view that includes all types of elements (artefacts, phases, events, etc.). For those in which they were less involved (they actually have a marginal participation, delimited to the technical tasks) their ICMMs are much poorer and less varied, containing artefacts almost exclusively. The analysis of other ICMMs, and the cross-reading of them with the information about the involvement in the project from interviews, confirmed that this is indeed a general trend: the individual perspective on the project does not depend on the person or role only, but also on her/his degree of involvement, in a clearly traceable way, as follows:
For technical roles (i.e., non-content/teaching-oriented: instructional designer, web programmer, graphic designer), the individual view of the project depends on the degree of involvement in the project itself. People with low involvement will mainly see artefacts; people with average involvement will see artefacts and phases/activities; people with high involvement will see artefacts, phases/activity and events (both internal and external).
Tools concepts and organization concepts do not seem to be connected with this trend. The vision is mainly connected to roles: web programmers are more concerned about tools, and project leaders are more concerned about organizational matters.
The fourth research question deals with how the eLab fast prototyping model is implemented in general—an issue that could be investigated through observing team SMMS and the global SMM. The eLab model should describe the team’s activities, so that the shared activities included in SMMs should bear some relationship to it. Clearly, this analysis describes how this specific model is implemented in the context of this study, and it does not claim that the same model would be implemented in the same way elsewhere, or that the same adaptation strategy would be used with another model, in this or another context.
The global SMM (see Figure 8) contains 5 concepts (prototype, implementation, test, graphic design, courseware structure) in a strongly interconnected network: concept values range from 9 to 12, out of 15 interviewees, and all concepts with a value over 8 are actually present in all three projects. Moreover, the 5 concepts are all present in all team SMMs except one (structure).

Just like team SMMs, the global SMM also contains only phases and artefacts, indicating that artefacts seem to be important to the team, even if ID models usually focus on phases only.
The diagrams show that there is a relation between the fast prototyping model and SMMs: the global SMM can be mapped to the eLab model, as shown in Figure 9. Moreover, team SMMs include other phases (design, revision) and artefacts (scenario, survey) included in the eLab model. As already mentioned above, non-shared activities such as assessment, technology selection, etc., are performed by individual members and are present in ICMMs.
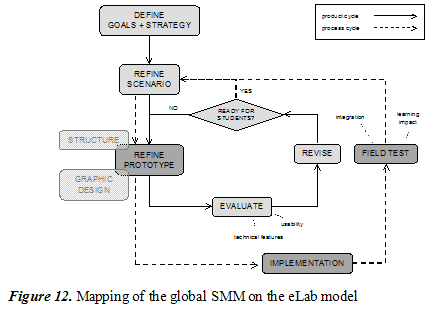
The distribution of individual and shared activities observed in this study could be generalized as a research hypothesis to be tested with other models and in different contexts. I call this the Treffpunkt Hypothesis (from the German for “Meeting Point”), as follows:
Implementing an ID model for a project means (also) (a) implicitly or explicitly assigning specific activities to single members, to the whole group or simply skipping them if unnecessary; and (b) conceiving and implementing artefacts that support the activities and that allow sharing of the results.
In short, this hypothesis means that the activities described in a theoretical design model are (implicitly) distributed to different roles, and that the process is made coherent by the development of shared artefacts that create a bridge between different activities and roles. Shared activities and artefacts represent the meeting points of the team members, who would otherwise walk different paths. Probably, as reported by Kenny et al. (2005), it also means including other activities, such as project management.
The mapping deserves some additional remarks. First of all, shared activities are distributed along the process cycle, while the activities in the product cycle, more technical, are left to individual members. Second, the artefacts included in the global SMM all refer to the refine prototype phase of the model – this indicates that the team comes together especially when setting up the instructional product, mostly in the fine-tuning and not in the design the precedes it. Third, scenario development, which in the model has a strong team-building value, is not counted among shared activities – it is usually left to the SME and the instructional designer. Fourth, graphic design is important in prototyping, probably more than generally stated in ID models: it cannot be left as a later refinement, and it looks to be essential in creating a communicative and effective prototype (the same holds for the courseware structure – but this is already and justly part of the conventional ID narrative). Fifth, and interestingly, the three artefacts present in the global SMM cover the three technical profiles in the team: graphic design for the graphic designer, structure for the instructional designer, prototype for the web programmer. It can be read as an indication of the recognized complementarity of profiles and competencies. Finally, the complete process as described by the model, which actually seems to occur if one simply superimposes all ICMMs, is not visible by anybody, as each member has a different partial perspective on the project.
The eLab model is strongly recursive, but data from the interviews reveal that this is not perceived as such. Interviewees feel the process is linear, and that there are true cycles, i.e., decisions made anew, only for specific features (e.g., for content, for the logo or graphic design, etc.). It is, as one interviewee put it, “a linear process with micro-vortexes.” Or, as another one said, “we have linear development with a cycle for each module, generating a sort of snowball-effect.”
This study is purely descriptive in nature: its goal is to bring useful data for discussion and to formulate sensible research hypotheses for future work. Its methods deliver detailed but hardly generalizable results.
The study is also delimited in its scope, as it investigates a single institutional setting, and a single type of project, namely large financed e-learning development projects. I expect that there would be different results in another university, or in a corporate setting, in which social practices and relationships are different; the same is likely to happen with different types of projects, e.g., in a distance university that regularly develops online courses. In order to provide additional insights, a twin study was led, with the same methodology, on three projects at the Universitat Oberta de Catalunya, in Barcelona, Spain. The results will be reported in a forthcoming article.
The limitation in scope is also found in team selection: the size of teams is similar, and the composition is also similar. We need to explore what would happen with larger teams, or in team with more or less different backgrounds of team members.
Finally, one of the strengths of the study is that it is focused on a single ID model – a choice that at the same time narrows its scope. The eLab model is also specific for e-learning, and is different from more traditional process oriented ID models. The Treffpunkt hypothesis tries to sum up the relevant findings of this study for the implementation of other models.
The first and more important result of this study is that design and development models in practice are an emergent feature: the team’s work has a definite shape, created by the interaction of their individual perspectives and possibly inspired by a theoretical model. No single team member has an omniscient view of it, or controls it completely. While this can clearly raise an issue for process accountability – or maybe partly explains why it is so difficult to manage the quality of ID processes – it also indicates that team communication is a key skill for instructional designers, and should be valued in their education and standards.
More specific research hypotheses were formulated in the text: the Communication enhancer hypothesis, the Extending view hypothesis, and the Treffpunkt hypothesis. These are left as stimuli in the hope that they can serve for interpreting data and inspiring further studies.
A second important result concerns the method: the investigation of communication in ID teams delivers interesting insights, as communication is a key element of the practice of designing and developing instruction, which means essentially bringing together different people to collaborate. The AC-SMM method actually identified shared elements in mental models, and it is promising for future research of this kind. Finally, sociograms are simple tools for controlling the extension and balance of the communication environment, and provide useful insights when cross-analyzed with other data sources.
This research direction could be extended as an alternative method for studying and understanding ID as a practice. The main assumptions behind it are that (a) the literature already provides a huge amount of indications and guidelines about what good design should be; and (b) there are many instructional designers and instructional design teams that design and develop effective products. Observing them, telling their stories and having them explicate and express their practices, ideas and feelings may help us with understanding how ID theory is understood, adapted and applied in cases of effective practice. The hypotheses formulated throughout the text are proposed as indications for the next steps in this direction.
1. For the purposes of this study, I understand e-learning as defined by the Commission of the European Community: “the use of new multimedia technologies and the Internet to improve the quality of learning by facilitating access to resources and services as well as remote exchanges and collaboration” (CEC, 2001).
2. S/T is the percentage of shared concepts out of the total number of concepts, while V/M is the average value of shared concepts weighted on the number of team members.
Andrews, D. H., & Goodson, L. A. (1995). A comparative analysis of models of instructional design. In G. Anglin (Ed.), Instructional technology. Past, present, and future (pp. 161–182). Englewood, CO: Libraries Unlimited, Inc.
Bates, T. W., & Poole, G. (2003). Effective teaching with technologies in higher education. San Francisco, CA: Jossey-Bass.
Bates T. W. (1999). Managing technological change: Strategies for college and university leaders. San Francisco, CA: Jossey Bass.
Berkowitz, S. D. (1982). An introduction to structural analysis: The network approach to social research. Toronto: Butterworth.
Botturi, L. (in press). E2ML. A visual language for the design of instruction. Educational Technologies Research & Development, 54(3).
Botturi, L., Cantoni, L., Lepori, B., & Tardini, S. (in press). Fast Prototyping as a Communication Catalyst for E-Learning Design. In M. Bullen & D. Janes (eds.), Making the transition to e-Learning: Strategies and Issues. Hershey, PA: Idea Group.
Campbell, K., Schwier, R. A., & Kenny, R. F. (2005). Agency of the instructional designer: Moral coherence and transformative social practice. Australasian Journal of Educational Technology, 21(2), 242–262. Retrieved July 15, 2005, from http://www.ascilite.org.au/ajet/ajet21/campbell.html
CEC (2001). The eLearning Action Plan: Designing tomorrow’s education, COM(2001)172, Brussels, 28.3.2001. Retrieved June, 24, 2005 from http://europa.eu.int/comm/education/policies/ntech/ntechnologies_en.html
Coffey, J. W., Eskridge, T. C., & Sanchez, D. P. (2004). A case study in knowledge elicitation for institutional memory preservation using concept maps. Proceedings of the First International Conference on Concept Mapping, Pamplona, Spain 2004. Retrieved July 14, 2005, from http://cmc.ihmc.us/papers/cmc2004-274.pdf
Coffey, J. W., Hoffman, R. R., Cañas, A. J., & Ford, K. M. (2002). A concept map-based knowledge modeling approach to expert knowledge sharing. Proceedings of IKS 2002, St. Thomas, Virgin Islands, USA
Cox, S., & Osguthorpe, R.T. (2003, May / June). How do instructional design professionals spend their time? TechTrends, 47(3), 45–47.
Dick, W., Carey, W., & Carey, L. (2001). The systematic design of instruction (6 th edition). New York: Harper Collins College Publishers.
Dicks, D. (2005). Building a science of instructional design. In Proceedings of EDMEDIA 2005, Montreal, Canada.
Johnson, T. E., O’Connor, D. L., & Darabi, A. A. (2005). Do great minds think alike? A study of shared mental models in performance improvement teams. Paper presented at the AECT Annual Convention, Orlando, FL.
Kenny, R. F., Zhang, Z., Schwier, R. A., & Campbell, K. (2005). A Review of What Instructional Designers Do: Questions Answered and Questions Not Asked. Canadian Journal of Learning and Technology, 31(1), 9–26.
Kirkpatrick, D. L. (1998). Evaluating training programs: the four levels. San Francisco, CA: Berrett-Koehler Publishers.
Leshin, C. B., Pollock, J., & Reigeluth, C. M. (1992). Instructional Design Strategies and Tactics. Englewood Cliffs, NJ: Educational Technology Publications.
Liu, M., Gibby, S., Quiros, O., & Demps, E. (2002). Challenges of being an instructional designer for new media development: A view from the practitioners. Journal of Educational Multimedia and Hypermedia, 11(3), 195–219.
Morrison, G. R., Ross, S. M., & Kemp, J. E. (2003). Designing Effective Instruction (4 th Ed.). New York: Wiley & Sons.
Novak, J. D., & Gowin, D. B. (1984). Learning how to learn. Ithaca, NY: Cornell University Press.
Novak, J. D. (n.d.). The Theory Underlying Concept Maps and How To Construct Them. Retrieved July 14, 2005, from http://cmap.coginst.uwf.edu/info/
O’Connor, D. L., & Johnson, T. E. (2004). Measuring team cognition: Concept mapping elicitation as a means of constructing team shared mental models in an applied setting. In A. J. Canas, J. D. Novak, & F. M. Gonzalez (Eds.), Concept Maps: Theory, Methodology, Technology, Vol 1. Proceedings of the First International Conference on Concept Mapping (pp. 487–493). Pamplona, Spain: Public University of Navarra.
O’Connor, D. L., Johnson, T. E., Khalil, M., Lee, M., & Huang, S. (2004). Team cognition: measuring shared mental models in performance improvement teams. Paper presented at the AECT Annual Convention, Chicago, IL.
Richey, R. C., Fields, D. C., & Foxon, M. (2000). Instructional design competencies: The standards (3 rd ed.). Syracuse, NY: ERIC Clearing-house on Information & Technology. Retrieved May 12, 2004, from http://www.neiu.edu/~dbehrlic/hrd408/ibstipicompetencies.htm
Rogers, E. M. (1995). Diffusion of innovations (4 th ed.). New York: The Free Press
Scott, J. (1991). Social network analysis: a handbook. London; Newbury Park, CA: SAGE Publications
SVC (n.d.). Swiss Virtual Campus Program Website. Retrieved December 16, 2005, from http://www.virtualcampus.ch
Trochim, W. M. K. (Ed.). (1989). Evaluation and Program Planning, 12 [special issue on concept mapping for planning and evaluation]
Trochim W. M. K., Cook, J. A., & Setze, R. J. (1994). Using Concept Mapping to Develop a Conceptual Framework of Staff's Views of a Supported Employment Program for Persons with Severe Mental Illness. Journal of Consulting and Clinical Psychology, 62(4), 766–775. Retrieved July 14, 2005, from http://www.socialresearchmethods.net/research/ccp/tcands.htm
Visscher-Voerman, J. I. A. (1999). Design Approaches in Training and Education: A reconstructive study. Doctoral dissertation, University of Twente, Enschede, the Netherlands.
Wiley, D.A. (Ed.). (2000a). Connecting learning objects to instructional design theory: A definition, a metaphor, and a taxonomy. Retrieved December 16, 2005, from http://reusability.org/read/chapters/
Willis, J. (2000, January/February). The maturing of constructivist instructional design: Some basic principles that can guide practice. Educational Technology, 40(1), 5–16.
The protocol reports the main questions asked / addressed during each interview. According to the specific situation, it happened that some points were discussed before or after where they occur in the list. For the graphic interview, the interviewer provided continuous support in making clear diagrams.
© Canadian Journal of Learning and Technology