
Tang Minh Dung, Ho Chi Minh City University of Education, Vietnam
Vo Khoi Nguyen, Ho Chi Minh City University of Education, Vietnam
Ðoàn Cao Minh Trí, Ho Chi Minh City University of Education, Vietnam
Phú Lúóng Chí Quõc, Ho Chi Minh City University of Education, Vietnam
Bui Hoang Dieu Ban, Ho Chi Minh City University of Education, Vietnam
The rapid rise of artificial intelligence (AI), exemplified by ChatGPT, has transformed education. However, few studies have examined the factors influencing its adoption in higher education, especially among Mathematics student teachers. This study investigates factors that influence the behavioural intentions of Mathematics student teachers regarding using ChatGPT. Guided by the Unified Theory of Acceptance and Use of Technology (UTAUT) model, data were collected through a questionnaire of 24 items across six factors on a 5-point Likert scale. Using multiple linear regression analysis with RStudio, the findings reveal that Intrinsic Motivation, Performance Expectancy, Social Influence, and Perceived Trust positively affect behavioural intentions to adopt ChatGPT. The study emphasizes implications for developers and educators to enhance AI integration in education, thereby supporting personalized and engaging learning experiences.
Keywords: artificial intelligence, behavioural intention, ChatGPT, Mathematics student teacher
L’essor rapide de l’intelligence artificielle (IA), illustré par ChatGPT, a transformé l’éducation. Cependant, peu d’études ont examiné les facteurs influençant son adoption dans l’enseignement supérieur, en particulier parmi les stagiaires en mathématiques. Cette étude examine les facteurs qui influencent les intentions comportementales des stagiaires en mathématiques concernant l’utilisation de ChatGPT. Guidés par le modèle de la théorie unifiée de l’acceptation et de l’utilisation des technologies (UTAUT), les données ont été collectées au moyen d’un questionnaire de 24 éléments portant sur six facteurs sur une échelle de Likert à 5 points. À l’aide d’une analyse de régression linéaire multiple avec RStudio, les résultats révèlent que la motivation intrinsèque, les attentes en matière de performance, l’influence sociale et la confiance perçue affectent positivement les intentions comportementales d’adopter ChatGPT. L’étude met l’accent sur les implications pour les personnes développeuses et enseignantes d’améliorer l’intégration de l’IA dans l’éducation, soutenant ainsi des expériences d’apprentissage personnalisées et engageantes.
Mot-clés : ChatGPT, intelligence artificielle, intentions comportementales, stagiaires en mathématiques
Artificial intelligence (AI) has emerged as a social phenomenon appearing in many fields. One prominent AI tool today is ChatGPT, developed by OpenAI. With the release of version 4.0, which is more complete compared to previous versions, and equipped with a vast source of information and data from the Internet, along with the ability to learn and converse in a way that mimics human interaction, ChatGPT has garnered significant attention for its advanced features, pushing the boundaries of what chatbots can achieve (Jo, 2023). Additionally, its accessibility from any device and OpenAI’s free use policy via personal email registration have enhanced its popularity.
Regardless of accuracy and source information, ChatGPT is a versatile tool for students’ educational purposes. It provides text replies, offers translations, and helps with writing tasks. It also facilitates calculations, assists in solving mathematical problems, and supports understanding of complex mathematical concepts for those studying Mathematics.
Since its public release in 2022, ChatGPT has generated significant interest across various sectors, notably research in understanding ChatGPT adoption. Research on behavioural intentions concerning ChatGPT and the factors impacting it continues to grow (Bernabei et al., 2023; Duong et al., 2023; Lai et al., 2023; Ma & Huo, 2023; Menon & Shilpa, 2023; Strzelecki, 2023).
Studies underscore the need for education to adapt and equip individuals with the skills and knowledge necessary to thrive via the integration of rapidly evolving technology into education (Firat & Köksal, 2019; Kale, 2018; Keengwe & Bhargava, 2013; Voogt et al., 2012). However, as Montenegro-Rueda et al. (2023) pointed out, scientific research on using ChatGPT in education is still scarce, likely due to its recent emergence. Nevertheless, the limited existing research highlights a growing interest and signals an emerging trend of broader adoption of ChatGPT. For example, Kabudi (2022), Lo (2023), and Sullivan et al. (2023) indicate that an increasing number of teachers and students are adopting ChatGPT, drawn to its potential to enhance learning experiences. Similarly, Talan and Kalinkara (2023) report its broad integration into higher education, emphasizing its appeal. Even so, as Montenegro-Rueda et al. (2023) stress, not enough studies have been conducted to address the specific use of ChatGPT in higher education. Given that educational technology, including ChatGPT, is an evolving field, its implementation in higher education remains relatively new and underexplored compared with other educational levels.
Albion et al. (2010) argue that teacher quality is crucial for student success, with Teo and Milutinovic (2015) emphasizing teachers’ key role in effectively integrating technology into education. Szymkowiak et al. (2021) further highlight that students often emulate teachers who use modern technologies in their teaching. These findings underscore that the use of technology integration in teaching largely depends on teachers (Marshall & Cox, 2008) and technology integration should focus on achieving pedagogical goals rather than being driven by technology itself (Angeli & Valanides, 2009; Enochsson, 2009). Therefore, teachers must thoughtfully and purposefully adopt technology to shape its effective use in education. Marshall and Cox (2008) and Teo and Milutinovic (2015) emphasize that the training period is a critical time for teachers to develop proficiency in using technology for teaching. Early preparation ensures that future teachers can effectively integrate technological tools into their classrooms (Agyei & Voogt, 2011; Drent & Meelissen, 2008). Student teachers are pivotal to this process as they represent the next generation of educators who will shape how emerging technologies such as ChatGPT are adopted and utilized in education. Consequently, there is a need for comprehensive research into the factors influencing student teachers’ behavioural intentions of using ChatGPT.
Mathematics requires a high degree of precision both in logical reasoning and in resultant outcomes. Notwithstanding its capacity to enhance mathematical education, ChatGPT often delivers inaccurate or irrelevant responses, particularly to complex problems or those necessitating a comprehensive understanding of mathematical principles (Lo, 2023; Wardat et al., 2023). Furthermore, it may generate solutions that surpass students’ cognitive abilities or the expectations of educational programs (Egara & Mosimege, 2024). This dichotomy—between the significant potential of ChatGPT in Mathematics education and its propensity for errors in a domain that demands the highest level of precision—renders the behavioural intentions of Mathematics student teachers unique, potentially setting them apart from their peers in other disciplines.
Given this context, this research aims to identify the factors influencing Mathematics student teachers’ behavioural intention toward ChatGPT. The article’s primary objective is to address the question: What factors influence Mathematics student teachers’ behavioural intention of using ChatGPT for educational purposes at university?
Addressing this research gap will help us better understand how student teachers actively embrace ChatGPT to enhance their learning experiences and academic success, starting with future Mathematics educators. This will provide foundational insights that could offer valuable guidance for the strategic implementation of AI tools in education. Ultimately, these insights could inform broader educational strategies and future research in curriculum development, teacher training, and AI tool refinement.
To investigate the determinants influencing Behavioural Intention (BI) towards the utilization of ChatGPT thoroughly, we employed a modified iteration of the Unified Theory of Acceptance and Use of Technology (UTAUT) model posited by Venkatesh et al. (2003), which has garnered extensive validation within the realm of technology acceptance research. The sample consisted of Mathematics student teachers from a university of education. Given the constraints associated with accessing this demographic, we engaged a Mathematics educator and four student teachers to ascertain pivotal variables (factors) likely to exert the most significant influence on BI. Following this preliminary analysis, we retained three fundamental variables from the original UTAUT model—Performance Expectancy (PE), Social Influence (SI), and Effort Expectancy (EE)—due to their consistent affirmation in prior empirical studies. Furthermore, the Facilitating Conditions factor in the UTAUT model was excluded as it has been determined that Vietnamese student teachers typically possess adequate access to ChatGPT through the web platform (www.chatgpt.com). Additionally, OpenAI provides free versions of ChatGPT, enabling users to access and utilize it for basic purposes. To enhance the study’s contextual applicability, we integrated two variables: Perceived Trust (PT), as informed by Rahim et al. (2022) — which addresses issues of integrity, ethics, and privacy in the context of AI-based chatbot usage — and Intrinsic Motivation (IM), sourced from Davis et al. (1992) — which captures the distinct enthusiasm and engaged involvement of younger users (ages 18–22) with emerging technologies (Table 1).
Table 1
Definitions of Factors
| Factor | Definition (in the case of ChatGPT) | Reference |
| BI | The level of the strength of the user’s intention to use a ChatGPT. | Ajzen (2020), Fishbein & Ajzen (1977) |
| EE | The level of ease associated with using ChatGPT. | Duong et al. (2023), Rahim et al. (2022), Venkatesh et al. (2003) |
| IM | Refers to the internal drive to engage in using ChatGPT for the inherent satisfaction it brings instead of external rewards or pressures. This includes the fun, enjoyment, pleasantness, and interest that interacting with ChatGPT brings. | Davis et al. (1992) |
| PE | The level to which the user perceives that using ChatGPT will help them to attain gains in study performance. | Nikolopoulou et al. (2021), Venkatesh et al. (2003) |
| PT | The level of user’s perceptions about the expected reliability, integrity, and privacy of ChatGPT. | Menon & Shilpa (2023), Rahim et al. (2022) |
| SI | The level to which the user perceives that significant others believe he or she should use ChatGPT. | Venkatesh et al. (2003) |
Note. BI is Behavioural Intention; EE is Effort Expectancy; IM is Intrinsic Motivation; PE is Performance Expectation; PT is Perceived Trust; SI is Social Influence.
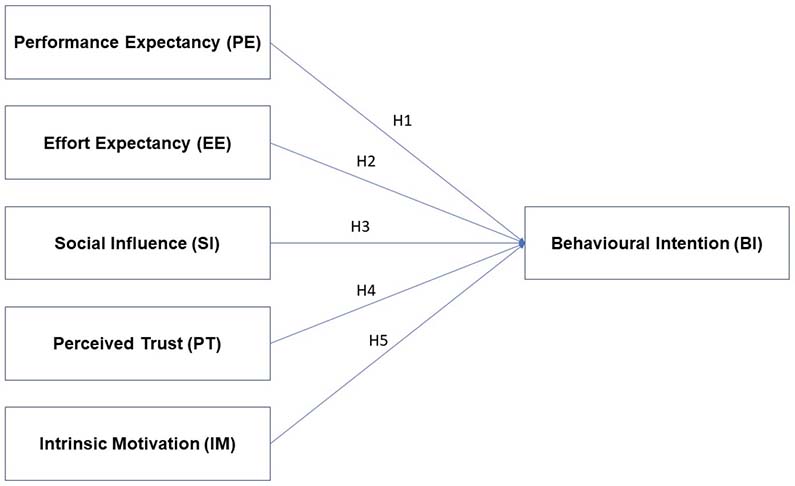
The following hypotheses are suggested (Figure 1):
H1: Performance Expectancy is positively correlated with Behavioural Intention to use ChatGPT.
H2: Effort Expectancy is positively correlated with Behavioural Intention to use ChatGPT.
H3: Social Influence is positively correlated with Behavioural Intention to use ChatGPT.
H4: Perceived Trust is positively correlated with Behavioural Intention to use ChatGPT.
H5: Intrinsic Motivation is positively correlated with Behavioural Intention to use ChatGPT.
Figure 1
Hypotheses Suggested
To test the hypotheses, a quantitative approach was used to explore the factors influencing BI according to the UTAUT model.
First year to fourth year student teachers in the Department of Mathematics at a university of education in Vietnam were surveyed. We visited classrooms and had student teachers scan a QR code to participate in the survey through Google Forms. Participants were informed that their participation was voluntary, and their responses would be confidential and used solely for academic purposes. The survey was carried out from January 21, 2024, to March 29, 2024.
Criteria by Hair et al. (2018) were used to estimate the total sample size needed for Exploratory Factor Analysis (EFA). Specifically, the minimum sample size is 50, but a size of 100 or more is preferred. Additionally, the number of valid responses (excluding those who had never heard of ChatGPT or student teachers in their fifth year or beyond) should be at least five times the number of survey questions. Since there were 24 survey questions, a minimum of 120 valid responses were needed. Additionally, Green (1991) suggests that if the purpose is to evaluate factors from each independent variable, such as t-tests or testing the regression coefficient, the minimum sample size for a regression analysis should be 104 + m (where m is the number of independent variables). Out of 281 responses received, 274 were deemed valid. Non-serious answers like selecting the same level for all items, were removed. Thus, this sample size was considered suitable for EFA.
Table 2 shows the general and demographic characteristics of the study sample after the data were cleaned. Notably, only 16.4% of student teachers answered Never to the question Frequency of ChatGPT use, indicating that ChatGPT usage had become relatively common. However, with only 15.3% of student teachers responding Frequently, it can be concluded that ChatGPT had not yet been widely adopted in their daily lives.
Table 2
Participant Demographics (N = 274)
| Variable | N | % | |
| Gender | Male | 163 | 59.5 |
| Female | 111 | 40.5 | |
| Grade | First | 88 | 32.1 |
| Second | 76 | 27.7 | |
| Third | 65 | 23.7 | |
| Fourth | 45 | 16.4 | |
| Frequency of ChatGPT use | Frequently | 42 | 15.3 |
| Sometimes | 187 | 68.2 | |
| Never | 45 | 16.4 | |
Participants were asked to provide demographic information and respond to a questionnaire consisting of 24 items structured into six factors (PE, EE, SI, PT, IM, and BI) with four items in each factor (Table 1). All items were adapted from existing studies and modified to fit the survey context among Mathematics student teachers and scored using a 5-point Likert scale, ranging from 1 (strongly disagree) to 5 (strongly agree).
RStudio software was used to process the cleaned data, following these analytical steps: (1) testing factors and measuring scales, (2) testing the factors affecting behavioural intention to use ChatGPT, (3) conducting multiple linear regression analysis, and (4) investigating the influence of moderator variables on the model (Figure 2).
Figure 2
Steps of Data Analysis
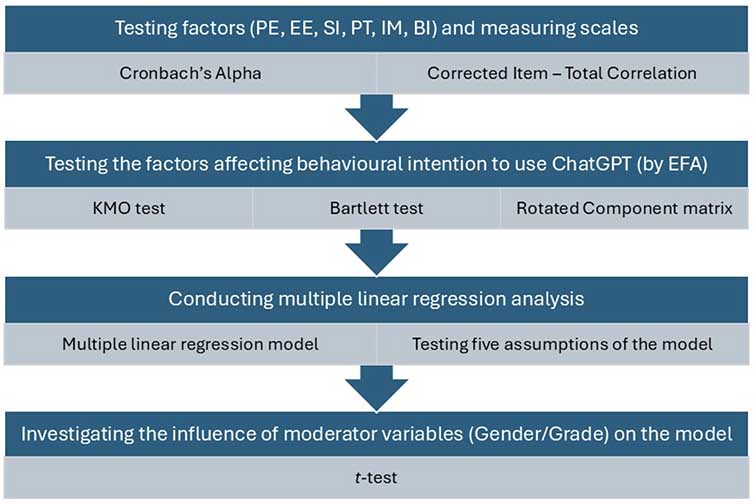
Note. BI = Behavioural Intention, EE = Effort Expectancy, EFA = Exploratory Factor Analysis, IM = Intrinsic Motivation, KMO = Kaiser-Meyer-Olkin, PE = Performance Expectancy, PT = Perceived Trust, and SI = Social Influence.
Cronbach’s Alpha (or coefficient alpha) measures reliability or internal consistency. The term Reliability refers to how a survey (or questionnaire) measures what it is supposed to measure. This study used Cronbach’s Alpha to verify the survey reliability based on the Likert scale with multiple questions. A high Cronbach’s Alpha result of a factor indicates that the listed observed variables are closely related, accurately reflecting the characteristics of the parent factor. Conversely, a low result suggests that the observed variables might be measuring something else or not measuring anything at all. In the statistics results, the following indices were considered: Overall Alpha (raw_alpha) of the factors, Coefficient Alpha of each observed variable in the raw_alpha column in the Reliability if an item is dropped table, and Corrected Item – Total Correlation coefficient in the r.drop column of the Item statistics table.
According to Henseler et al. (2009) and Hair et al. (2018), a suitable scale should have an Overall Alpha greater than 0.7. Further, Hoang and Chu Nguyen (2008) suggest that the Cronbach’s Alpha coefficient values are as follows: if Coefficient Alpha is between 0.8 and 1.0, the scale is very good; if Coefficient Alpha is between 0.7 and 0.8, the scale is good; if Coefficient Alpha is greater than 0.6, the scale is acceptable.
For the Reliability if an item is dropped table, each row refers to each observed variable and the Coefficient Alpha if the item is dropped. This value will be evaluated with the Corrected Item – Total Correlation coefficient in the Item statistics table. A good scale will have a Corrected Item – Total Correlation coefficient greater than 0.3 (Cristobal et al., 2007). If the Coefficient Alpha after dropping an item is greater than the Overall Alpha, and the Corrected Item – Total Correlation coefficient of that variable is less than 0.3, the observed variable will be removed to increase the scale’s reliability. If the Coefficient Alpha after dropping an item is slightly higher than the following Overall Alpha (the difference is less than 0.1) but the Corrected Item – Total Correlation coefficient of that variable is greater than 0.3, we consider keeping it.
In this study many items generated by the questionnaire can be interrelated, complicating the interpretation and analysis of data. Exploratory factor analysis was used to group variables that were correlated with each other into more general underlying factors, thereby providing a clearer view of the data by reducing the original list of variables to fewer easily interpretable common factors.
Before conducting EFA, the Kaiser-Meyer-Olkin (KMO) test and the Bartlett test were used to confirm that the dataset were suitable for this type of analysis. According to Kaiser (1974), a KMO value greater than 0.5 and a p-value less than 0.05 indicate that the correlation among observed variables is sufficient for EFA. For the Bartlett test, if the p-value is less than 0.05, it suggests that the observed variables within the factor are correlated.
Parallel analysis was used to determine the number of factors to extract from the data for EFA. Next, we assessed the scale’s values through EFA, where two essential values were considered: convergent validity and discriminant validity. According to Hair et al. (2018), in the rotation matrix table, if the factor loading of an observed variable within a factor is at least 0.5, the observed variable is good quality. According to Pituch and Stevens (2015), a factor is considered reliable if it comprises more than three measuring variables. For convergent validity, observed variables of the same nature converge towards the same factor; when displayed in the Rotated Component matrix, these variables will be in the same column. For discriminant validity, observed variables converge towards this factor and must be distinct from observed variables converging on other factors; when displayed in the Rotated Component matrix, each group of variables will separate out into distinct columns.
After removing observed variables with factor loading of less than 0.5, we rearranged our factors and conducted a second round of EFA analysis for these new variables.
The factors were entered into the regression model. We used multiple linear regression analysis to examine the hypotheses about the impact of the new factors on BI in the model, thereby testing five proposed hypotheses with statistical significance at the level of 5%.
After the analysis we tested five of the assumptions of the multiple linear regression model to ensure that our model was statistically meaningful.
Assumption 1: Normal distribution of the model’s residuals.
+ The residuals are normally distributed when the p-value of the Anderson-Darling test is less than 0.05, or the Normal Q-Q Plot of residuals has all points concentrated around the line y = x.
+ The residuals have a mean of zero if the p-value of the t-test is greater than 0.05.
+ The residuals have constant variance: We can check this with the Goldfeld-Quandt test if the p-value is greater than 0.05 or using the Scatter Plot of Standardized Residuals and Standardized Fitted Values if the standardized residuals are randomly distributed around the line y = 0.
Assumption 2: Linear relationship between the dependent and independent variables. This assumption can be tested using the partial residual plot method. If the purple line is closer to the blue line, then the relationship between the dependent and independent variables is linear.
Assumption 3: No autocorrelation of the residual series. This assumption can be tested using the Durbin-Watson test. If the value d of this test is between 1.5 and 2.5, there is no autocorrelation.
Assumption 4: No significant outliers or highly influential points.
+ A point is an outlier if, in the Q-Q Plot, it does not lie too far from the line y = x.
+ A point may be an influential point if its Cook’s distance value is greater than 0.5.
Assumption 5: No multicollinearity. Multicollinearity occurs when the Variance Inflation Factor (VIF) is greater than 5 (Frost, 2019). Additionally, if the absolute value of the Pearson correlation coefficient is greater than 0.8, multicollinearity is likely to exist (Young, 2017).
Next, we evaluated the importance of each independent variable to the dependent variable based on the coefficient of determination Multiple R2 by Lindeman et al.’s (1980) method.
The moderator variables Gender and Grade were considered to emphasize the importance of demographics when studying participants’ BI in using ChatGPT. Specifically, we examined the impact of the moderator variables Gender and Grade on the linear regression models for the hypotheses. The metric used to test this impact was the p-value from the t-test, with a statistical significance of 5%.
For the moderator variable Gender, when assessing the impact of each variable Xi (EE, IM, PE, PT, SI) on the variable BI, two variables — the moderator variable Male and the interaction variable Xi Male — were added to the linear regression model. We concluded that there is an influence of the Gender variable on the original linear regression model if the value of the interaction variable Xi Male is less than 0.05, even when the Male variable individually has a p-value greater than 0.05. According to James et al. (2021), “The hierarchical principle states that if we include an interaction in a model, we should also include the main effects, even if the p-values associated with their coefficients are insignificant.” (p. 89). For the moderator variable Grade, we used a similar statistics analysis process.
To check survey reliability, based on the Likert scale with multiple questions, the Cronbach’s Alpha reliability test was used to ascertain whether the observed variables could represent the parent factor’s characteristics. This tool helped to determine which observed variables were appropriate and which were not suitable for inclusion in the scale. The test outcomes are shown in Table 3.
Table 3
Reliability Estimates
| Construct | Internal reliability Cronbach’s Alpha | Item | Cronbach’s Alpha, if an item is dropped | Corrected item – total correlation |
| BI | 0.88 | BI1 | 0.83 | 0.80 |
| BI2 | 0.84 | 0.79 | ||
| BI3 | 0.87 | 0.70 | ||
| BI4 | 0.87 | 0.71 | ||
| EE | 0.87 | EE1 | 0.81 | 0.75 |
| EE2 | 0.81 | 0.76 | ||
| EE3 | 0.80 | 0.79 | ||
| EE4 | 0.89 | 0.57 | ||
| IM | 0.90 | IM1 | 0.87 | 0.79 |
| IM2 | 0.88 | 0.77 | ||
| IM3 | 0.88 | 0.77 | ||
| IM4 | 0.87 | 0.79 | ||
| PE | 0.89 | PE1 | 0.85 | 0.77 |
| PE2 | 0.85 | 0.77 | ||
| PE3 | 0.86 | 0.75 | ||
| PE4 | 0.87 | 0.73 | ||
| PT | 0.82 | PT1 | 0.77 | 0.65 |
| PT2 | 0.77 | 0.67 | ||
| PT3 | 0.75 | 0.70 | ||
| PT4 | 0.81 | 0.57 | ||
| SI | 0.86 | SI1 | 0.81 | 0.74 |
| SI2 | 0.81 | 0.74 | ||
| SI3 | 0.82 | 0.72 | ||
| SI4 | 0.85 | 0.63 |
Note. BI is Behavioural Intention; EE is Effort Expectancy; IM is Intrinsic Motivation; PE is Performance Expectation; PT is Perceived Trust; SI is Social Influence.
Referencing Table 3, we noted that the Internal Reliability Cronbach’s Alpha of the parent factors ranged from 0.82 to 0.9, which satisfied the reliability threshold (greater than 0.7). Each row in the Cronbach’s Alpha if an item is dropped column referred to the Overall Alpha if the corresponding observed variable is dropped. The findings revealed that all observed variables contributed meaningfully, except for EE4. Regarding the Corrected Item – Total Correlation coefficient column, all values exceed 0.3, signifying a robust correlation between each observed variable and the remaining variables within the scale. Based on these insights, we deduced that the factor scale possessed adequate reliability and exhibited strong consistency. Moreover, we considered the exclusion of the observed variable EE4 to enhance the scale’s reliability. In the EFA test phase, relying on the Rotated Component matrix, we excluded the observed variable EE4.
Exploratory factor analysis was utilized to examine the factors influencing the intention to use ChatGPT among Mathematics student teachers. According to the initial hypothesis, there were six factors (24 observed variables). Hair et al. (2018) and Nguyen (2014) stated that separate EFA analyses were required for the independent and the dependent variables.
For the EFA suitability test, a KMO value of 0.92 indicated that the dataset were appropriate for exploratory factor analysis (i.e., > 0.5). The result of Barlett’s test with a p-value less than 0.05 showed that the correlation among the variables was sufficiently significant to conduct EFA.
Parallel analysis indicated that five factors needed to be extracted for the independent variables. The results from the Rotated Component matrix revealed that the variable EE4, with a factor loading below 0.5, was excluded from the model. The remaining variables, each with a factor loading greater than 0.5, were organized into five factors.
A second EFA was conducted, satisfying the criteria of the KMO test (KMO value = 0.92), Barlett’s test (p-value < 0.05), and parallel analysis (five factors extracted from the data). The results from the Rotated Component matrix indicated that 19 observed variables were divided into five factors, all of which had factor loading of at least 0.5 (Table 4). These five factors explained 66% of the variance in the data of the 19 observed variables involved in the EFA.
Table 4
Rotated Component Matrix (second round)
| Construct | Factor 1 | Factor 2 | Factor 3 | Factor 4 | Factor 5 |
| PE1 | 0.74 | ||||
| PE2 | 0.80 | ||||
| PE3 | 0.69 | ||||
| PE4 | 0.66 | ||||
| PT1 | 0.66 | ||||
| PT2 | 0.65 | ||||
| PT3 | 0.79 | ||||
| PT4 | 0.50 | ||||
| EE1 | 0.83 | ||||
| EE2 | 0.83 | ||||
| EE3 | 0.70 | ||||
| SI1 | 0.77 | ||||
| SI2 | 0.85 | ||||
| SI3 | 0.57 | ||||
| SI4 | 0.52 | ||||
| IM1 | 0.67 | ||||
| IM2 | 0.55 | ||||
| IM3 | 0.61 | ||||
| IM4 | 0.65 |
Note. BI is Behavioural Intention; EE is Effort Expectancy; IM is Intrinsic Motivation; PE is Performance Expectation; PT is Perceived Trust; SI is Social Influence.
The dependent variable was conducted using a process similar to that of the independent variable. For the EFA suitability test, a KMO value of 0.83 indicated that the dataset were suitable for exploratory factor analysis. The result of Bartlett’s test with a p-value less than 0.05 indicated that the correlation among the variables was sufficiently significant to conduct EFA.
Parallel analysis showed that one factor needed to be extracted for the dependent variable. The factor loadings for BI1, BI2, BI3, and BI4 were 0.88, 0.87, 0.75, and 0.75, respectively. These factors explained 66% of the variance in the data from the four observed variables involved in the EFA.
After conducting the EFA, the observed variables were reorganized and subsequently included in the multiple linear regression model (Table 5).
Table 5
Revised Factors and Variables
| Factors | Observed Variables | Variable Type |
| X1 (PE) | PE1, PE2, PE3, PE4 | Independent |
| X2 (EE) | EE1, EE2, EE3 | Independent |
| X3 (SI) | SI1, SI2, SI3, SI4 | Independent |
| X4 (PT) | PT1, PT2, PT3, PT4 | Independent |
| X5 (IM) | IM1, IM2, IM3, IM4 | Independent |
| Y (BI) | BI1, BI2, BI3, BI4 | Dependent |
Note. BI is Behavioural Intention; EE is Effort Expectancy; IM is Intrinsic Motivation; PE is Performance Expectation; PT is Perceived Trust; SI is Social Influence.
According to Table 5, we had the analysis model: Y = f (X1, X2, X3, X4, X5). By performing multiple regression analysis, we observed that the impact of the variable X2 (EE) on the dependent variable Y (BI) was not statistically significant, as the p-value of the t-test was 0.879, which is greater than 0.05. The remaining variables all positively impacted the dependent variable Y (BI). Therefore, the variable X2 (EE) was removed from the model.
Figure 3
The Resulting Linear Regression Model
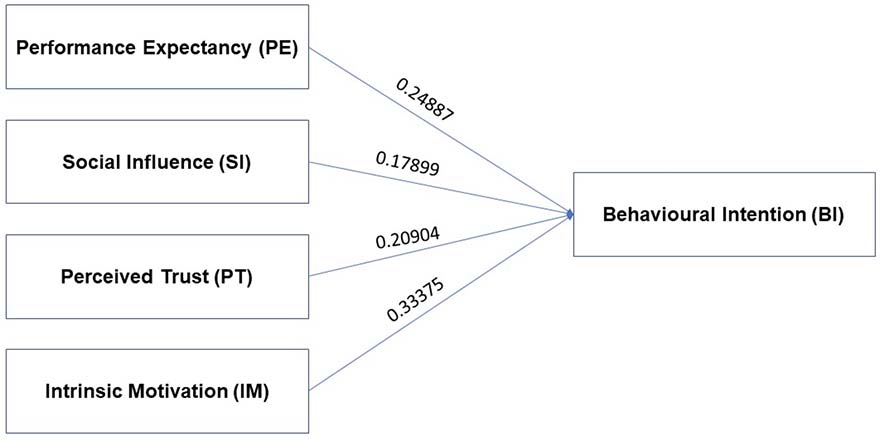
After removing the variable EE, the resulting linear regression model is:
| Y = 0.12299 + 0.24887X1 + 0.17899X3 + 0.20904X4 + 0.33375X5 + ε | (*) |
where ε represented the residuals of the linear regression model (Figure 3).
We evaluated the fit of the multiple linear regression model through the Adjusted R2, which reflects the extent to which the independent variables in the regression model explain the dependent variable. The Adjusted R2 is 66.99, indicating that the independent variables IM, PE, PT, and SI explain 66.99% of the variance in the dependent variable BI, and factors outside the research model explain the remaining 33.01% of the BI variance. The F-test is 139.5 with a rejection probability of less than 0.05, which was sufficient to conclude that the multiple linear regression model is appropriate for the dataset under study.
Next, we proceeded to test the assumptions of the multiple regression model.
Assumption 1: Normal distribution of the model’s residuals. The Anderson-Darling test yielded a p-value = 0.03535 < 0.05, combined with the Normal Q-Q Plot (Figure 4), confirming that the model’s residuals were normally distributed.
Figure 4
Normal Q-Q Plot
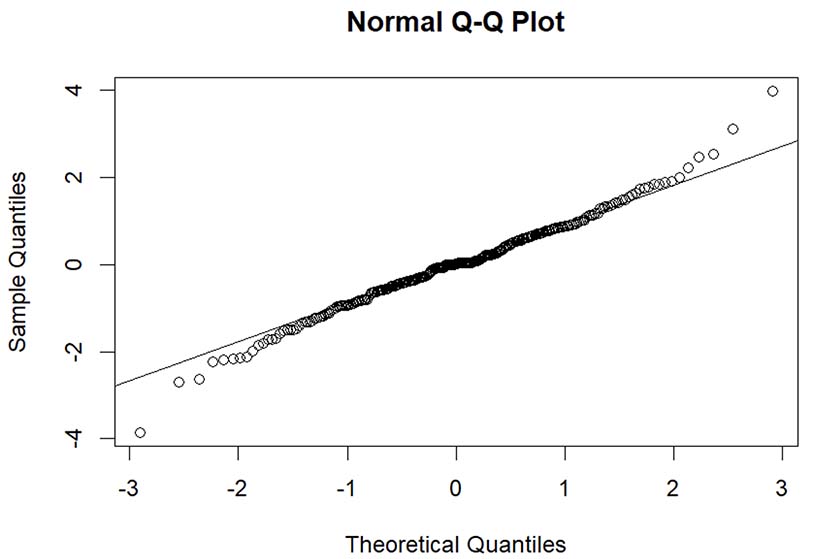
Note. Figure generated from the data processing software.
The t-test resulted in a p-value = 0.9998 > 0.05, indicating that the residuals had a zero mean.
Based on the Scatter Plot of Standardized Residuals and Standardized Fitted Values (Figure 5) and a p-value from the Goldfeld-Quandt test greater than 0.05, we concluded that the residuals had constant variance.
Figure 5
Standardized Residuals and Standardized Fitted Values
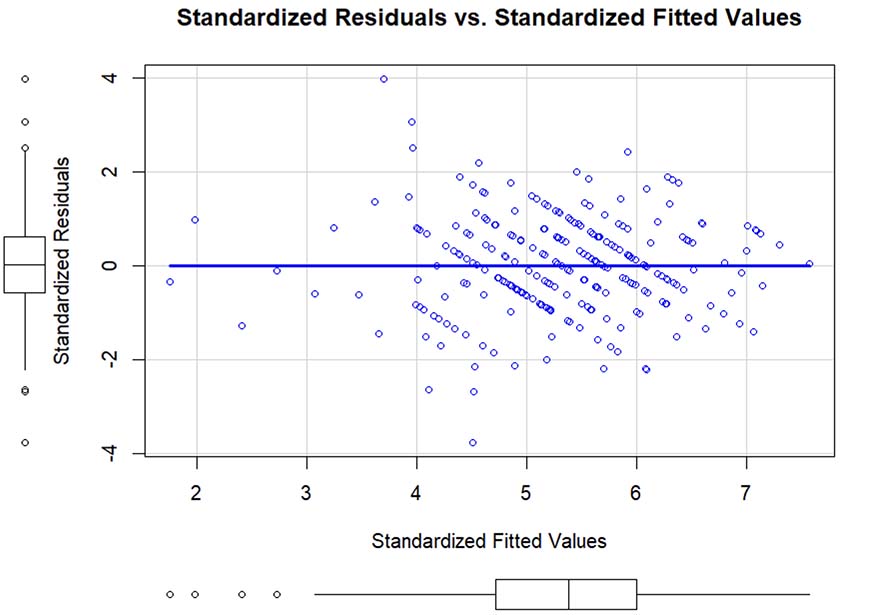
Note. Figure generated from the data processing software.
Assumption 2: Linear relationship between the dependent and independent variables. Figure 6 demonstrates a linear relationship between the dependent and independent variables.
Figure 6
Partial Residual Plots
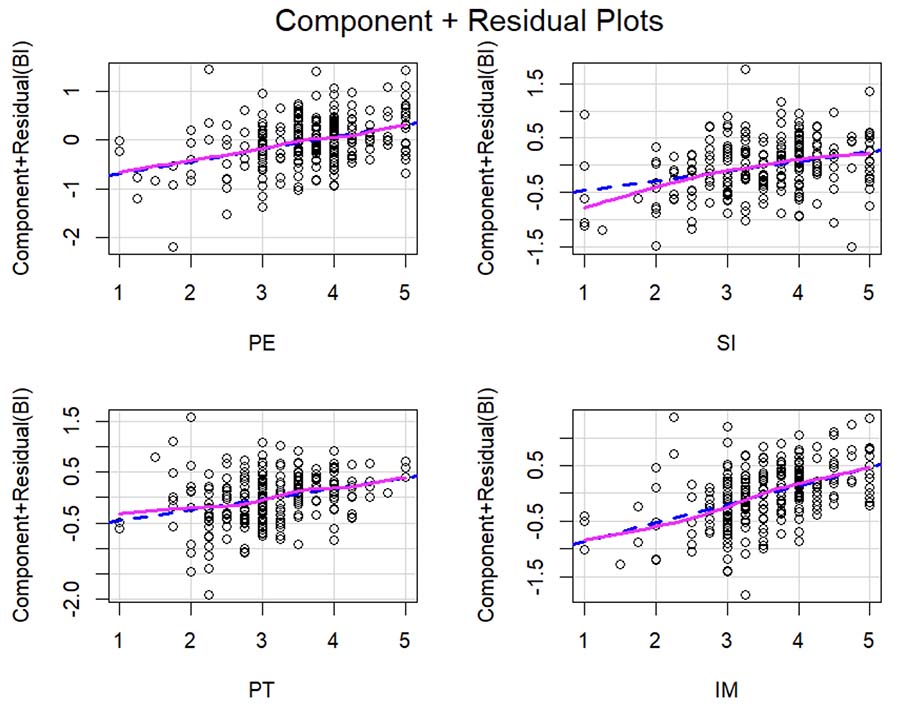
Note. Figure generated from the data processing software.
Assumption 3: No autocorrelation of the residual series. The Durbin-Watson test produces d = 2.1071 in the interval 1.5 and 2.5. Hence, we concluded that there was no autocorrelation of the residual series.
Assumption 4: No significant outliers or highly influential points. Figure 7 demonstrates that the model had nearly no significant outliers or highly influential points.
Figure 7
Q-Q Plot and Cook’s Distance (x2) Plot
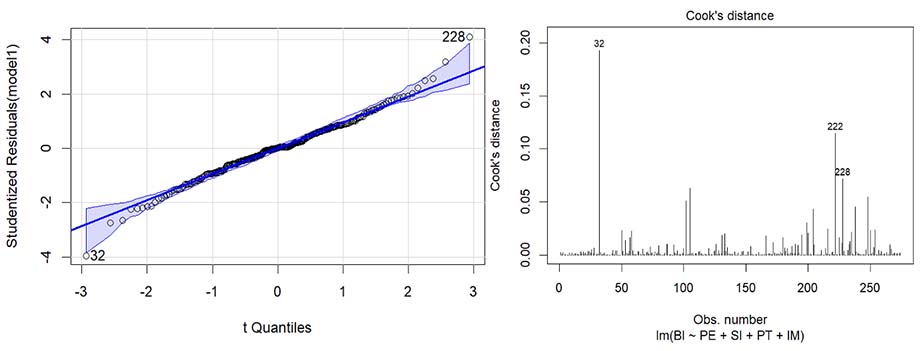
Note. Figure generated from the data processing software.
Assumption 5: No multicollinearity. The results showed that the independent variables had VIFs less than 2.5, and the absolute values of the Pearson correlation coefficients were less than 0.7 (Figure 8), indicating that no multicollinearity occurs.
The test results indicated that our model satisfied all five assumptions. Therefore, we concluded that the independent variables IM, PE, PT, and SI positively impact the dependent variable BI. The regression equation (*) was statistically significant.
Next, we assessed the importance of each predictor variable to the dependent variable using the “lmg” method (Lindeman et al., 1980). The findings showed that the R2 of the model is 67.47%, with the variables SI, PT, PE, and IM having R2 values of 13.93%, 14.63%, 17.18%, and 21.73%, respectively. Consequently, IM had the most significant influence on the dependent variable BI, whereas SI had the most minor influence.
Figure 8
Pearson’s Correlation Coefficients
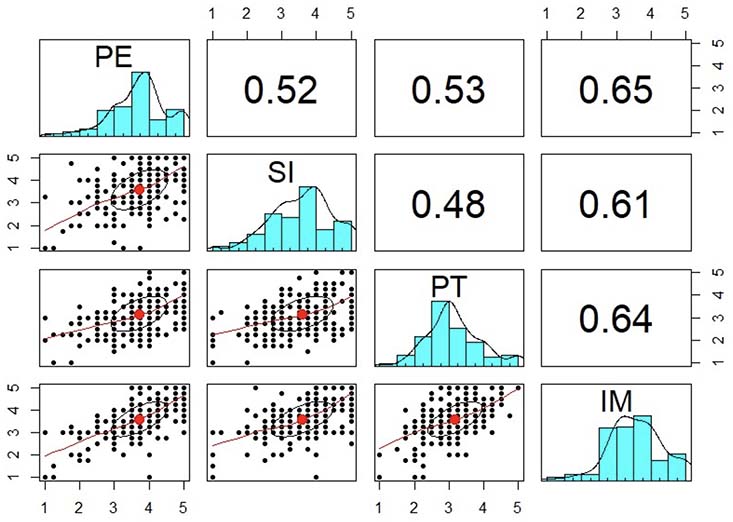
Note. Figure generated from the data processing software.
We tested the impact of the moderator variables Gender and Grade on the linear regression models of hypotheses H1, H3, H4, and H5 based on the p-value of the t-test for the coefficients of the moderator variables and the interaction variables added. The results showed that these p-values were all greater than the 5% significance level. This indicates that the differences are insufficient to conclude that the moderator variables Gender and Grade influence the models.
This study deepens understanding of Mathematics student teachers’ perceptions of ChatGPT in educational contexts, addressing a significant research gap. Utilizing the UTAUT scale, findings identified key factors influencing their BI toward ChatGPT, which is essential for AI integration discussions in education. Results showed that IM, PE, PT, and SI positively impacted BI, with IM being the most significant. However, SI had a low impact on BI. This research underscored the varied influences of UTAUT constructs on the acceptance and use of ChatGPT among student teachers.
Intrinsic Motivation was observed to be the most substantial positive influence on the BI of Mathematics student teachers towards using ChatGPT. This finding aligns with recent studies emphasizing the central role of IM in adopting technological aids in educational contexts, which pointed out a positive correlation between IM and BI (Hsu & Lin, 2021). In the context of ChatGPT, Lai et al. (2023) found that IM was a critical factor for Hong Kong undergraduates’ use of ChatGPT, primarily driven by the pleasure and satisfaction derived from its use in addressing academic questions. Therefore, our findings indicated that if student teachers find ChatGPT interesting to interact with, they will have a greater intention to use it. Moreover, our findings supported those of Li and Yanagisawa (2021), who identified IM as a significant motivator in virtual assistant interactions.
In our research, PE was identified as a crucial predictor of BI to use ChatGPT among Mathematics student teachers, ranking second in importance. Our data indicated that student teachers with higher levels of PE were more inclined to integrate ChatGPT into their learning processes. This observation aligns with previous research in the domain of ChatGPT within educational settings, including studies by Alshammari and Alshammari (2024), Duong et al. (2023), Foroughi et al. (2023), and Strzelecki (2023), and extends to chatbot research, as seen in Rahim et al. (2022) and Tian et al. (2024). This may be due to the nature of math, where students need to find precise solutions to advanced math problems, explain complex math concepts, or develop activities appropriate to teaching in the context of Mathematics.
This study discovered that PT had a positive but moderate influence on the BI of Mathematics student teachers towards using ChatGPT. This aligns with Rahim et al. (2022), who found a direct relationship between PT and BI among postgraduate students within the context of ChatGPT, and with Cheng and Jiang (2020) and De Cosmo et al. (2021) in chatbot research. This indicated that if student teachers’ trust issues are not a concern, they will likely prefer using ChatGPT. However, Menon and Shilpa (2023) indicated that although most respondents admitted to being aware that their interactions and information with ChatGPT are not confidential, they still found it safe and secure.
In addition, our study unveiled that SI had a low impact on the BI of Mathematics student teachers to use ChatGPT, aligning with findings in similar ChatGPT research by Strzelecki (2023) and in chatbot studies by Rahim et al. (2022) and Tian et al. (2024). Alshammari and Alshammari (2024) and Foroughi et al. (2023) even found no impact of SI on BI within the context of ChatGPT. This demonstrates SI’s indirect influence on students’ behavioural intentions regarding using ChatGPT for the educational purposes of university student teachers. However, this contrasts with studies by Singh et al. (2020) on mobile wallet services and Terblanche and Kidd (2022) on chatbots, where users were concerned with the opinions of their family, friends, and colleagues regarding using a chatbot.
Contrary to our initial hypothesis, EE did not significantly impact Mathematics student teachers’ BI to use ChatGPT, aligning with findings from Alshammari and Alshammari (2024) and Strzelecki (2023) on ChatGPT, and Rahim et al. (2022) and Tian et al. (2024) on chatbots. This reveals that student teachers do not perceive difficulties with using ChatGPT, suggesting minimal effort is required to utilize this technology in higher education, hence its negligible influence on BI. This may be due to the recent development of information technology applications in teaching, especially in Mathematics teaching, which has made student teachers accustomed to accessing new technologies.
This study provides valuable insights into how Mathematics student teachers perceive and intend to use ChatGPT, offering practical guidance for developers, educational institutions, and educators to optimize its integration into educational settings.
Given that Intrinsic Motivation (IM) significantly influences Behavioural Intention (BI), it is essential to organize workshops that illustrate the capabilities of ChatGPT in fostering creativity within the educational field. These workshops could exemplify the generation of lesson plans, engaging activities, and real-world applications of Mathematics. Additionally, the pedagogical insights and recommendations offered by ChatGPT present innovative resources and persuasive solutions to the diverse challenges and inquiries faced by student teachers.
In light of Performance Expectancy (PE), it is crucial for different stakeholders to enhance ChatGPT’s effectiveness in the educational sphere. Developers should focus on refining the accuracy and relevance of responses (Getenet, 2024; Pham et al., 2024), particularly in challenging areas like advanced mathematics and abstract concepts, ensuring alignment with curriculum standards. Institutions need to offer training that highlight how ChatGPT can bolster teaching outcomes, such as developing differentiated instruction plans and supporting diverse learners through tailored problem-solving strategies. Educators should consider integrating ChatGPT into their teaching methods, using it not only to supplement traditional approaches but also to provide alternative explanations and facilitate complex problem-solving.
To enhance Social Influence (SI) within educational institutions, fostering collaboration among student teachers is essential. By encouraging future educators to work together, they can share insights and experiences on using ChatGPT effectively. This collaborative approach will help cultivate a culture where technology integration is recognized as valuable and aligns seamlessly with established professional teaching practices. By modeling the appropriate use of ChatGPT, student teachers can pave the way for its acceptance and effective classroom implementation.
To foster Perceived Trust (PT) in ChatGPT, developers must prioritize transparency by addressing effectively users’ concerns regarding reliability, integrity, and privacy. This involves implementing clear disclaimers, robust privacy protections, and easily accessible mechanisms for reporting inaccuracies. Institutions can further bolster confidence in ChatGPT by educating users about its strengths and limitations, framing it as a supportive tool rather than a complete replacement for traditional methods. Additionally, educators play a crucial role by modeling responsible usage; they should verify ChatGPT’s outputs, promote critical evaluation among students, and discuss constructively any potential errors in the classroom setting, thereby nurturing a balanced approach to technology in learning environments.
This study was conducted in Vietnam, a developing country, which may limit the generalizability of our findings to other regions with different technological and cultural contexts. The participant pool was confined to Mathematics students from a teacher training institution. Future research could be broadened to include all university students and faculty or extended to other institutions. Moreover, given the rapid advancements in AI, some aspects of our research need to be updated quickly. Therefore, future studies should explore ChatGPT’s use in more diverse and novel contexts.
This study was limited to specific variables influencing Behavioural Intention (BI), as outlined in the Theoretical Framework section. Although the selected factors provided valuable insights, broader external variables such as educational policies, access, or institutional support also play a critical role in shaping learning outcomes. These factors may influence significantly the adoption of ChatGPT among student teachers. Future research should examine these external influences to develop a more comprehensive understanding of the multifaceted elements impacting BI in educational contexts, particularly in regions where access to technology and institutional frameworks vary significantly.
Additionally, our focus on utilizing ChatGPT for general educational purposes at the university level limited our capacity to provide nuanced insights into its integration, specifically within Mathematics education. Future inquiries should explore how ChatGPT can be adapted to fulfill the distinctive requirements of Mathematics education, including resolving complex problems, enhancing conceptual understanding, and creating engaging instructional activities. Such research could offer guidelines for integrating ChatGPT into preservice teacher training programs, ultimately equipping future educators with the competencies necessary to effectively incorporate AI technologies into their instructional practices.
Our study applied the Unified Theory of Acceptance and Use of Technology (UTAUT) model to explore factors that influence the intention of Mathematics student teachers to use ChatGPT. We found that Performance Expectancy (PE), Perceived Trust (PT), Intrinsic Motivation (IM), and Social Influence (SI) positively affected students’ intentions to use ChatGPT, whereas Effort Expectancy (EE) did not. These findings demonstrate ChatGPT’s potential as an effective teaching and learning support tool. A focus on raising perception of the usefulness and performance of ChatGPT can promote its adoption in educational settings, especially in the context of current digital transformation. The research results provide important information for the development of teacher training programs, helping them to become familiar with and effectively use AI technologies such as ChatGPT in the future. At the same time, the research also contributes to the development and improvement of AI tools, especially in the educational field, by identifying important factors that influence user acceptance. These insights suggest future research on the cross-cultural applicability and expanded demographic inclusion, underlining its implications for curriculum development, teacher training, and AI tool refinement.
Agyei, D. D., & Voogt, J. (2011). ICT use in the teaching of mathematics: Implications for professional development of pre-service teachers in Ghana. Education and Information Technologies, 16, 423-439. https://doi.org/10.1007/s10639-010-9141-9
Ajzen, I. (2020). The theory of planned behavior: Frequently asked questions. Human Behavior and Emerging Technologies, 2(4), 314-324. https://doi.org/10.1002/hbe2.195
Albion, P., Jamieson-Proctor, R., & Finger, G. (2010). Auditing the TPACK confidence of Australian pre-service teachers: The TPACK confidence survey (TCS). In D. Gibson & B. Dodge (Eds.), Society for Information Technology & Teacher Education International Conference (pp. 3772-3779). Association for the Advancement of Computing in Education (AACE). https://www.learntechlib.org/primary/p/33969/
Alshammari, S. H., & Alshammari, M. H. (2024). Factors affecting the adoption and use of ChatGPT in higher education. International Journal of Information and Communication Technology Education, 20(1), 1-16. https://doi.org/10.4018/IJICTE.339557
Angeli, C., & Valanides, N. (2009). Epistemological and methodological issues for the conceptualization, development, and assessment of ICT—TPCK: Advances in technological pedagogical content knowledge (TPCK). Computers & Education, 52(1), 154-168. https://doi.org/10.1016/j.compedu.2008.07.006
Bernabei, M., Colabianchi, S., Falegnami, A., & Costantino, F. (2023). Students’ use of large language models in engineering education: A case study on technology acceptance, perceptions, efficacy, and detection chances. Computers & Education: Artificial Intelligence, 5, 100172. https://doi.org/10.1016/j.caeai.2023.100172
Cheng, Y., & Jiang, H. (2020). How do AI-driven chatbots impact user experience? Examining gratifications, perceived privacy risk, satisfaction, loyalty, and continued use. Journal of Broadcasting & Electronic Media, 64(4), 592-614. https://doi.org/10.1080/08838151.2020.1834296
Cristobal, E., Flavián, C., & Guinalíu, M. (2007). Perceived e‐service quality (PeSQ): Measurement validation and effects on consumer satisfaction and web site loyalty. Managing Service Quality: An International Journal, 17(3), 317-340. https://doi.org/10.1108/09604520710744326
Davis, F. D., Bagozzi, R. P., & Warshaw, P. R. (1992). Extrinsic and intrinsic motivation to use computers in the workplace. Journal of Applied Social Psychology, 22(14), 1111-1132. https://doi.org/10.1111/j.1559-1816.1992.tb00945.x
De Cosmo, L. M., Piper, L., & Di Vittorio, A. (2021). The role of attitude toward chatbots and privacy concern on the relationship between attitude toward mobile advertising and behavioral intent to use chatbots. Italian Journal of Marketing, 2021(1-2), 83-102. https://doi.org/10.1007/s43039-021-00020-1
Drent, M., & Meelissen, M. (2008). Which factors obstruct or stimulate teacher educators to use ICT innovatively? Computers & Education, 51(1), 187-199. https://doi.org/10.1016/j.compedu.2007.05.001
Duong, C. D., Vu, T. N., & Ngo, T. V. N. (2023). Applying a modified technology acceptance model to explain higher education students’ usage of ChatGPT: A serial multiple mediation model with knowledge sharing as a moderator. International Journal of Management Education, 21(3), 100883. https://doi.org/10.1016/j.ijme.2023.100883
Egara, F. O., & Mosimege, M. (2024). Exploring the integration of artificial intelligence-based ChatGPT into Mathematics instruction: Perceptions, challenges, and implications for educators. Education Sciences, 14(7), 742. https://doi.org/10.3390/educsci14070742
Enochsson, A.-B. (2009). ICT in initial teacher training. Organisation for Economic Co-operation and Development. https://citeseerx.ist.psu.edu/document?repid=rep1&type=pdf&doi=5dcec359fa38aa677c4beabf85b7257284ee6b18
Firat, E. A., & Köksal, M. S. (2019). Effects of instruction supported by web 2.0 tools on prospective teachers’ biotechnology literacy. Computers & Education, 135, 61-74. https://doi.org/10.1016/j.compedu.2019.02.018
Fishbein, M., & Ajzen, I. (1977). Belief, attitude, intention, and behavior: An introduction to theory and research. Contemporary Sociology, 6, 244. https://api.semanticscholar.org/CorpusID:144301400
Foroughi, B., Senali, M. G., Iranmanesh, M., Khanfar, A., Ghobakhloo, M., Annamalai, N., & Naghmeh-Abbaspour, B. (2023). Determinants of intention to use ChatGPT for educational purposes: Findings from PLS-SEM and fsQCA. International Journal of Human—Computer Interaction, 40, 4501-4520. https://doi.org/10.1080/10447318.2023.2226495
Frost, J. (2019). Regression analysis: An intuitive guide for using and interpreting linear models. Statistics by Jim Publishing.
Getenet, S. (2024). Pre-service teachers and ChatGPT in multistrategy problem-solving: Implications for mathematics teaching in primary schools. International Electronic Journal of Mathematics Education, 19(1), em0766. https://doi.org/10.29333/iejme/14141
Green, S. B. (1991). How many subjects does it take to do a regression analysis. Multivariate Behavioral Research, 26(3), 499-510. https://doi.org/10.1207/s15327906mbr2603_7
Hair, J. F., Black, B., Babin, B., & Anderson, R. E. (2018). Multivariate data analysis (8th ed.). Cengage.
Henseler, J., Ringle, C. M., & Sinkovics, R. R. (2009). The use of partial least squares path modeling in international marketing. In R. R. Sinkovics & P. N. Ghauri (Eds.), New challenges to international marketing (Vol. 20, pp. 277-319). Emerald Group Publishing Limited. https://doi.org/10.1108/S1474-7979(2009)0000020014
Hoang, T., & Chu Nguyen, M. N. (2008). Phan tich du lieu nghien cuu voi SPSS 2008 (tap 1) [Research data analysis with SPSS 2008 (Volume 1)]. Hong Duc Publisher.
Hsu, H. T., & Lin, C. C. (2021). Extending the technology acceptance model of college learners’ mobile‐assisted language learning by incorporating psychological constructs. British Journal of Educational Technology, 53(2), 286-306. https://doi.org/10.1111/bjet.13165
James, G., Witten, D., Hastie, T., & Tibshirani, R. (2021). An introduction to statistical learning: with applications in R (2nd ed.). Springer.
Jo, H. (2023). Understanding AI tool engagement: A study of ChatGPT usage and word-of-mouth among university students and office workers. Telematics and Informatics, 85, 102067. https://doi.org/10.1016/j.tele.2023.102067
Kabudi, T. M. (2022, May). Artificial intelligence for quality education: Successes and challenges for AI in meeting SDG4. In Y. Zheng, P. Abbott, & J. A. Robles-Flores (Eds.), International conference on social implications of computers in developing countries (pp. 347-362). Springer. https://doi.org/10.1007/978-3-031-19429-0_21
Kaiser, H. F. (1974). An index of factorial simplicity. Psychometrika, 39(1), 31-36. https://doi.org/10.1007/BF02291575
Kale, U. (2018). Technology valued? Observation and review activities to enhance future teachers’ utility value toward technology integration. Computers & Education, 117, 160-174. https://doi.org/10.1016/j.compedu.2017.10.007
Keengwe, J., & Bhargava, M. (2013). Mobile learning and integration of mobile technologies in education. Education and Information Technologies, 19, 737-746. https://doi.org/10.1007/s10639-013-9250-3
Lai, C. Y., Cheung, K. Y., & Chan, C. S. (2023). Exploring the role of intrinsic motivation in ChatGPT adoption to support active learning: An extension of the technology acceptance model. Computers & Education: Artificial Intelligence, 5, 100178. https://doi.org/10.1016/j.caeai.2023.100178
Li, C., & Yanagisawa, H. (2021). Intrinsic motivation in virtual assistant interaction for fostering spontaneous interactions. Plos One, 16(4), e0250326. https://doi.org/10.1371/journal.pone.0250326
Lindeman, R. H., Merenda, P. F., & Gold, R. Z. (1980). Introduction to bivariate and multivariate analysis. Scott, Foresman and Company. https://doi.org/10.2307/2287559
Lo, C. K. (2023). What is the impact of ChatGPT on education? A rapid review of the literature. Education Sciences, 13(4), 410. https://doi.org/10.3390/educsci13040410
Ma, X., & Huo, Y. (2023). Are users willing to embrace ChatGPT? Exploring the factors on the acceptance of chatbots from the perspective of AIDUA framework. Technology in Society, 75, 102362. https://doi.org/10.1016/j.techsoc.2023.102362
Marshall, G., & Cox, M. J. (2008). Research methods: Their design, applicability and reliability. In J. Voogt & G. Knezed (Eds.), International handbook of information technology in primary and secondary education (pp. 983-1002). Springer. https://doi.org/10.1007/978-0-387-73315-9_62
Menon, D., & Shilpa, K. (2023). “Chatting with ChatGPT”: Analyzing the factors influencing users’ intention to Use the Open AI’s ChatGPT using the UTAUT model. Heliyon, 9(11), e20962. https://doi.org/10.1016/j.heliyon.2023.e20962
Montenegro-Rueda, M., Fernández-Cerero, J., Fernández-Batanero, J. M., & López-Meneses, E. (2023). Impact of the implementation of ChatGPT in education: A systematic review. Computers, 12(8), 153. https://doi.org/10.3390/computers12080153
Nikolopoulou, K., Gialamas, V., & Lavidas, K. (2021). Habit, hedonic motivation, performance expectancy and technological pedagogical knowledge affect teachers’ intention to use mobile internet. Computers and Education Open, 2, 100041. https://doi.org/10.1016/j.caeo.2021.100041
Nguyen, D. T. (2014). Giao trinh phuong phap nghien cuu khoa hoc trong kinh doanh [Textbook on Scientific Research Methods in Business]. Finance Publishing.
Pham, V. L. P., Vu, D. A., Hoang, N. M., Do, X. L., & Luu, A. T. (2024). ChatGPT as a math questioner? Evaluating ChatGPT on generating pre-university math questions. In J. Hong, J. W. Park, & A. Przybylek (Eds.), Proceedings of the 39th ACM/SIGAPP Symposium on Applied Computing (pp. 65-73). Association for Computing Machinery. https://doi.org/10.1145/3605098.363603
Pituch, K. A., & Stevens, J. P. (2015). Applied multivariate statistics for the social sciences (6th ed.). Routledge.
Rahim, N. I. M., Iahad, N. A., Yusof, A. F., & Al-Sharafi, M. A. (2022). AI-based chatbots adoption model for higher-education institutions: A hybrid PLS-SEM-neural network modelling approach. Sustainability, 14(19), 12726. https://doi.org/10.3390/su141912726
Singh, N., Sinha, N., & Liébana-Cabanillas, F. J. (2020). Determining factors in the adoption and recommendation of mobile wallet services in India: Analysis of the effect of innovativeness, stress to use and social influence. International Journal of Information Management, 50, 191-205. https://doi.org/10.1016/j.ijinfomgt.2019.05.022
Strzelecki, A. (2023). Students’ acceptance of ChatGPT in higher education: An extended unified theory of acceptance and use of technology. Innovative Higher Education, 49, 223-245. https://doi.org/10.1007/s10755-023-09686-1
Sullivan, M., Kelly, A., & McLaughlan, P. (2023). ChatGPT in higher education: Considerations for academic integrity and student learning. Journal of Applied Learning & Teaching, 6(1), 1-10. https://doi.org/10.37074/jalt.2023.6.1.17
Szymkowiak, A., Melović, B., Dabić, M., Jeganathan, K., & Kundi, G. S. (2021). Information technology and Gen Z: The role of teachers, the internet, and technology in the education of young people. Technology in Society, 65, 101565. https://doi.org/10.1016/j.techsoc.2021.101565
Talan, T., & Kalınkara, Y. (2023). The role of artificial intelligence in higher education: ChatGPT assessment for anatomy course. Uluslararası Yönetim Bilişim Sistemleri ve Bilgisayar Bilimleri Dergisi [International Journal of Management Information Systems and Computer Science], 7(1), 33-40. https://doi.org/10.33461/uybisbbd.1244777
Teo, T., & Milutinovic, V. (2015). Modelling the intention to use technology for teaching mathematics among pre-service teachers in Serbia. Australasian Journal of Educational Technology, 31(4), 363-380. https://doi.org/10.14742/ajet.1668
Terblanche, N., & Kidd, M. (2022). Adoption factors and moderating effects of age and gender that influence the intention to use a non-directive reflective coaching chatbot. Sage Open, 12(2). https://doi.org/10.1177/21582440221096136
Tian, W., Ge, J., Zhao, Y., & Zheng, X. (2024). AI Chatbots in Chinese higher education: adoption, perception, and influence among graduate students—an integrated analysis utilizing UTAUT and ECM models. Frontiers in Psychology, 15, 1-16. https://doi.org/10.3389/fpsyg.2024.1268549
Venkatesh, V., Morris, M. G., Davis, G. B., & Davis, F. D. (2003). User acceptance of information technology: Toward a unified view. MIS Quarterly, 27(3), 425-478. https://doi.org/10.2307/30036540
Voogt, J., Fisser, P., Pareja Roblin, N., Tondeur, J., & van Braak, J. (2012). Technological pedagogical content knowledge—a review of the literature. Journal of Computer Assisted Learning, 29(2), 109-121. https://doi.org/10.1111/j.1365-2729.2012.00487.x
Wardat, Y., Tashtoush, M. A., AlAli, R., & Jarrah, A. M. (2023). ChatGPT: A revolutionary tool for teaching and learning mathematics. Eurasia Journal of Mathematics, Science and Technology Education, 19(7), em2286. https://doi.org/10.29333/ejmste/13272
Young, D. S. (2017). Handbook of regression methods. Chapman and Hall/CRC. https://doi.org/10.1201/9781315154701
Bartlett Test: A statistical test to check whether the variables in the dataset are related enough to perform EFA. A p-value less than 0.05 means the variables are sufficiently correlated.
Coefficient of Determination (R2): A value that explains how much of the variation in the dependent variable can be explained by the independent variables. Higher values indicate a better fit for the model.
Cronbach’s Alpha: A measure of how consistent the items in a survey or questionnaire are. Higher values (above 0.7) indicate that the survey items are reliable and measure the same concept.
Durbin-Watson Test: A test to check if residuals are independent or autocorrelated (they should not follow a pattern). A value between 1.5 and 2.5 indicates no autocorrelation.
Exploratory Factor Analysis (EFA): A statistical method to group related survey items into broader factors. This helps to simplify data and identify underlying relationships between variables.
Factor Loading: A number that shows how strongly an item is associated with a factor. Values above 0.5 are considered good.
Goldfeld-Quandt Test: A test used to check if the residuals have constant variance, which is an assumption for a valid regression model.
Interaction Variable: A term used in regression analysis to capture the combined effect of two variables (e.g., trust and gender) on the dependent variable.
Kaiser-Meyer-Olkin (KMO) Test: A test to determine if the data suits EFA. A value above 0.5 indicates that the data are adequate for this type of analysis.
Moderator Variable: A variable influencing the relationship between independent and dependent variables. For example, gender might affect how trust influences behavioural intention.
Multiple Linear Regression Analysis: A statistical method used to examine how several independent variables (e.g., motivations, trust) affect a dependent variable (e.g., behavioural intention).
Normal Q-Q Plot: A graphical tool to check if residuals follow a normal distribution (a key assumption for regression analysis).
p-value: A number that shows the probability of a result occurring by chance. A value below 0.05 is usually considered statistically significant.
Residuals: The differences between the observed values and those predicted by the regression model. They help assess the accuracy of the model.
Variance Inflation Factor (VIF): A measure to check if independent variables are highly correlated with each other (multicollinearity). Values above 5 indicate potential issues.
Tang Minh Dung, PhD, earned his doctorate in Mathematics - Informatics from Université Grenoble Alpes in France. He is a lecturer in the Department of Mathematics and Informatics at Ho Chi Minh City University of Education in Vietnam. His research focuses on teacher education and technology-enhanced mathematics education. Email: dungtm@hcmue.edu.vn ORCID: https://orcid.org/0000-0001-5401-1395
Vo Khoi Nguyen is a senior mathematics education student at the Department of Mathematics and Informatics, Ho Chi Minh City University of Education in Vietnam. His research focuses on harmonic analysis and teacher education. Email: 4701101107@student.hcmue.edu.vn ORCID: https://orcid.org/0009-0009-3738-6967
Ðoàn Cao Minh Trí is a senior mathematics education student at the Department of Mathematics and Informatics, Ho Chi Minh City University of Education in Vietnam. His research focuses on representation theory, number theory, and mathematics teaching methodology. Email: minhtridoancao06@gmail.com ORCID: https://orcid.org/0009-0001-7783-1393
Phú Lúóng Chí Quõc is a senior mathematics education student at the Department of Mathematics and Informatics, Ho Chi Minh University of Education in Vietnam. His research focuses on technology-enhanced mathematics education. Email: chiquocphuluong26012002@gmail.com ORCID: https://orcid.org/0009-0009-4151-954X
Bui Hoang Dieu Ban is a senior mathematics education student at the Department of Mathematics and Informatics, Ho Chi Minh University of Education in Vietnam. Her research focuses on technology-enhanced mathematics education and mathematics teaching methodology. Email: buihoangdieuban12012003@gmail.com ORCID: https://orcid.org/0009-0008-1696-1195